English
 Deutsch
 Polski
Monitoring Carts and Checkouts with GA4: Detecting Sudden Drops in Events

Management Summary
An e-commerce monitor watches how often products are added to carts and checkout is started. Using recent GA4 counts and a comparable period from the previous week, it can flag an unusual drop during an advertising campaign. This gives an earlier reason to investigate than waiting for a large sales shortfall. The counts describe recorded shopping activity, not a diagnosis: lower demand, changed consent or a broken measurement system can also cause the decline, rather than a faulty checkout.
Contents
A sudden fall in add_to_cart or begin_checkout can indicate a tracking problem, a checkout problem or simply less traffic. A small GA4 Realtime API monitor helps notice that change while a launch is still running. It measures reported events, not functioning carts, completed orders or revenue.
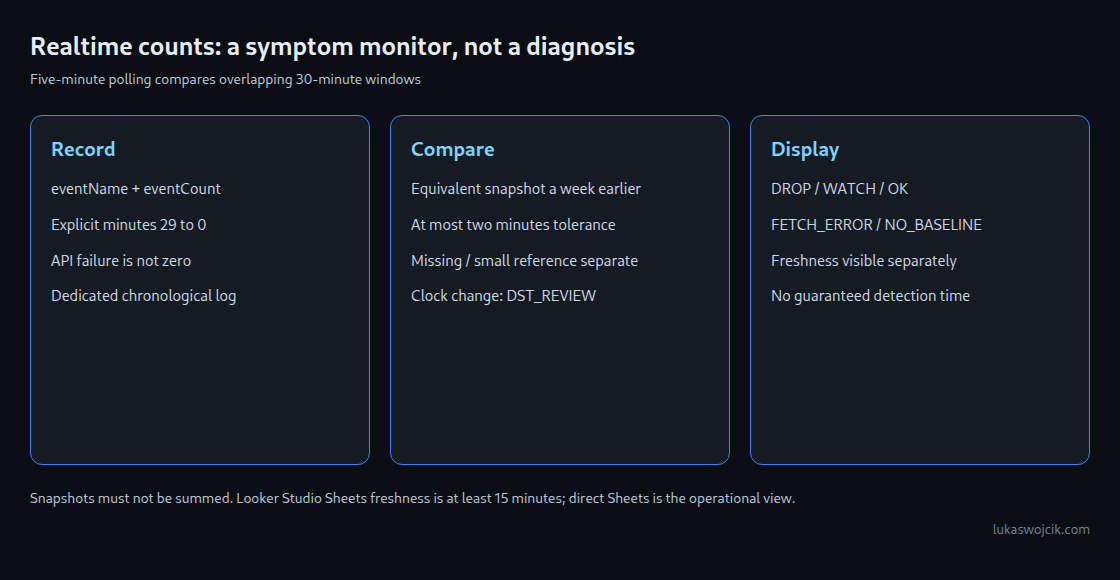
The example records the count for the preceding 30 minutes approximately every five minutes in Google Sheets. Each new reading moves this measurement window forward. A comparison uses a matching snapshot recorded one week earlier. Missing history, API failures and stale results receive separate states, so unavailable data cannot masquerade as healthy traffic or a zero-event outage.
1. Data source and setup
The Realtime API supports eventName and eventCount. Standard properties expose up to 30 minutes and Analytics 360 properties up to 60 minutes; this example explicitly requests minutes 29 through 0 for both. BigQuery also offers a streaming export with data available within minutes. Streaming is a different option with costs and possible gaps, so the choice here is simplicity rather than a supposed absence of streaming.
The setup needs a dedicated spreadsheet, a bound Apps Script project, GA4 read access for the executing account and the enabled Analytics Data advanced service. The associated Cloud project must also have the Google Analytics Data API enabled. The constants require the actual property resource, spreadsheet ID and property timezone.
A manual authorized run of pollRealtime creates two dedicated tabs: RT_Log for snapshots and RT_Status for the latest result. Existing tabs with these names must be reserved for this example; a mismatching header stops execution. After a successful setup check, an installable time-driven trigger can call pollRealtime every five minutes. It runs with the creator’s authorization and remains subject to quotas and scheduling delays. One trigger is sufficient.
2. Recording and comparing snapshots
// Dedicated spreadsheet; enable Analytics Data advanced service first.
const RT = {
  property: 'properties/XXXXXXXXX',
  spreadsheet: 'SPREADSHEET_ID',
  timezone: 'Europe/Warsaw',
  events: ['add_to_cart', 'begin_checkout'],
  window: 'rt_29_to_0_v1',
  minBaseline: 20,
  toleranceMs: 2 * 60 * 1000
};

function readCounts(response) {
  if (!response || !Array.isArray(response.dimensionHeaders) ||
      response.dimensionHeaders.length !== 1 ||
      response.dimensionHeaders[0].name !== 'eventName' ||
      !Array.isArray(response.metricHeaders) ||
      response.metricHeaders.length !== 1 ||
      response.metricHeaders[0].name !== 'eventCount') {
    throw new Error('Unexpected response schema');
  }
  const rows = response.rows || [];
  if (!Array.isArray(rows) || (response.rowCount || 0) !== rows.length) {
    throw new Error('Incomplete response');
  }
  const counts = {add_to_cart: 0, begin_checkout: 0};
  const seen = new Set();
  rows.forEach(row => {
    const name = row.dimensionValues && row.dimensionValues[0] && row.dimensionValues[0].value;
    const raw = row.metricValues && row.metricValues[0] && row.metricValues[0].value;
    if (!RT.events.includes(name) || seen.has(name) ||
        typeof raw !== 'string' || !/^\d+$/.test(raw)) throw new Error('Invalid row');
    const count = Number(raw);
    if (!Number.isSafeInteger(count)) throw new Error('Invalid count');
    counts[name] = count;
    seen.add(name);
  });
  return counts;
}

function compareCount(current, baseline) {
  if (baseline === null) return ['', 'NO_BASELINE'];
  if (baseline < RT.minBaseline) return ['', 'LOW_VOLUME'];
  const change = 100 * (current - baseline) / baseline;
  return [change, change <= -30 ? 'DROP' : change <= -15 ? 'WATCH' : 'OK'];
}

function baselineFor(history, time, event) {
  const target = time.getTime() - 7 * 24 * 60 * 60 * 1000;
  let best = null, distance = Infinity;
  history.forEach(row => {
    const timestamp = row[0] instanceof Date ? row[0].getTime() : NaN;
    const delta = Math.abs(timestamp - target);
    if (row[1] === event && row[3] === 'OK' && row[4] === RT.window &&
        row[5] === RT.property && Number.isSafeInteger(row[2]) && row[2] >= 0 &&
        delta <= RT.toleranceMs && delta < distance) {
      best = row[2]; distance = delta;
    }
  });
  return best;
}

function preparedSheet(book, name, header) {
  const sheet = book.getSheetByName(name) || book.insertSheet(name);
  if (sheet.getLastRow() === 0) sheet.getRange(1, 1, 1, header.length).setValues([header]);
  const actual = sheet.getRange(1, 1, 1, header.length).getValues()[0];
  if (JSON.stringify(actual) !== JSON.stringify(header)) throw new Error('Unexpected sheet header');
  return sheet;
}

function pollRealtime() {
  const lock = LockService.getScriptLock();
  if (!lock.tryLock(1000)) return;
  try {
    const book = SpreadsheetApp.openById(RT.spreadsheet);
    const log = preparedSheet(book, 'RT_Log', ['poll_time', 'event', 'count', 'fetch', 'window', 'property']);
    const dash = preparedSheet(book, 'RT_Status', ['poll_time', 'event', 'current', 'baseline', 'change_pct', 'status', 'freshness']);
    const history = log.getLastRow() > 1 ? log.getRange(2, 1, log.getLastRow() - 1, 6).getValues() : [];
    const time = new Date();
    let counts = null, fetch = 'OK';
    try {
      const request = {
        dimensions: [{name: 'eventName'}],
        metrics: [{name: 'eventCount'}],
        minuteRanges: [{startMinutesAgo: 29, endMinutesAgo: 0}],
        dimensionFilter: {filter: {fieldName: 'eventName', inListFilter: {values: RT.events, caseSensitive: true}}},
        limit: '2'
      };
      counts = readCounts(AnalyticsData.Properties.runRealtimeReport(request, RT.property));
      if (Date.now() - time.getTime() > 60000) throw new Error('Slow response');
    } catch (error) {
      counts = null; fetch = 'FETCH_ERROR';
    }
    const target = new Date(time.getTime() - 7 * 24 * 60 * 60 * 1000);
    const offsetChanged = Utilities.formatDate(time, RT.timezone, 'Z') !== Utilities.formatDate(target, RT.timezone, 'Z');
    const statusRows = RT.events.map((event, index) => {
      const baseline = baselineFor(history, time, event);
      const result = fetch !== 'OK' ? ['', 'FETCH_ERROR'] : offsetChanged ? ['', 'DST_REVIEW'] : compareCount(counts[event], baseline);
      return [time, event, counts ? counts[event] : '', baseline === null ? '' : baseline,
        result[0], result[1], `=IF((NOW()-A${index + 2})*1440>10,"STALE","FRESH")`];
    });
    const logRows = RT.events.map(event => [time, event, counts ? counts[event] : '', fetch, RT.window, RT.property]);
    log.getRange(log.getLastRow() + 1, 1, logRows.length, 6).setValues(logRows);
    dash.getRange(2, 1, statusRows.length, 7).setValues(statusRows);
    dash.getRange(2, 5, 2, 1).setNumberFormat('0.0');
    dash.getRange(2, 1, 2, 1).setNumberFormat('yyyy-mm-dd hh:mm:ss');
    // Trim only the chronological prefix of this dedicated log, preserving its header.
    const cutoff = time.getTime() - 14 * 24 * 60 * 60 * 1000;
    let oldRows = 0;
    while (oldRows < history.length && history[oldRows][0] instanceof Date &&
           history[oldRows][0].getTime() < cutoff) oldRows++;
    if (oldRows) log.deleteRows(2, oldRows);
  } finally {
    lock.releaseLock();
  }
}
The log stores a poll timestamp, event name, count, fetch state, window version and property. Fourteen days of chronological history provide the reference week. The log is maintained only by this script; manual sorting or mixed historical imports would break the assumption that the oldest entries are at the top, where cleanup starts. A changed request definition needs a new window version and fresh comparable history.
The reference is the nearest successful snapshot to 168 hours earlier, with a tolerance of two minutes. A missing match remains NO_BASELINE. A zero reference or a reference below 20 events remains LOW_VOLUME. This floor is a configurable noise-control heuristic, not a statistical confidence test. A timezone-offset change between the current and reference dates produces DST_REVIEW, because the same UTC instant-of-week no longer means the same local clock time.
A valid response with an omitted event row produces zero for that event. A failed request, malformed response or request lasting more than one minute instead produces blank counts and FETCH_ERROR. Sheet-access or write failures can still stop the script; the freshness indicator and Apps Script execution history are therefore essential checks. Script locking prevents overlapping runs within this project. Separate writes to the sheets can still succeed or fail independently: the log might be updated while the status sheet remains unchanged.
3. Status and visible freshness
The status uses the unrounded change: 100 × (current − baseline) / baseline. A decrease of at least 30% is DROP; a decrease from 15% up to, but not including, 30% is WATCH; other evaluated values are OK. These labels describe a heuristic comparison with one reference week. A promotion, holiday or unusual prior week can invalidate that reference.
Column G contains the freshness formula. Spreadsheet calculation must be set to recalculate on change and every minute, so NOW() advances even when polling stops. A result older than ten minutes is STALE; that threshold is also an operational choice. The timestamp remains visible, because a formula is not an independent uptime monitor.
Conditional formatting applies to A2:G3 in RT_Status. A gray rule for =$G2="STALE" takes precedence. Red uses =AND($G2="FRESH",$F2="DROP"); amber uses =AND($G2="FRESH",$F2="WATCH"). Other non-OK states need distinct neutral formatting. Old red or green results must not appear current after polling stops. Formula separators can require adjustment for the spreadsheet locale.
FRESH refers only to the age of this monitor run. A recently successful API request does not prove that GA4 received current events or that the source data is complete. An upstream collection delay can therefore coexist with a fresh dashboard timestamp.
4. Timing and interpretation
Each sample covers approximately 30 minutes, and samples taken five minutes apart overlap heavily. Adding the snapshots does not produce a daily event total. Under an idealized constant rate, a complete outage leaves about 25 healthy minutes in the first sample after five minutes: roughly a 17% decline. After ten minutes the illustrative decline is about 33%. Actual collection latency, minute boundaries, trigger timing and uneven traffic prevent a ten-minute detection guarantee.
An hourly processed report divided by two is not an equivalent half-hour observation. Such a conversion assumes uniform activity within the hour and mixes different processing stages. The example therefore uses recorded Realtime snapshots consistently and needs at least a week of suitable history. A daily reconciliation with shop transactions and processed analytics adds a separate check; neither a 14-day Z-score nor a rolling reference automatically detects every slow decline.
The direct Sheet is the operational view. The Looker Studio Google Sheets connector offers 15 minutes as its minimum and default data-freshness interval. A five-minute Apps Script schedule cannot turn that connector into a guaranteed five-minute display; report auto-refresh does not bypass the underlying freshness cache.

Questions and answers
Does a red result prove that checkout is broken?
No. Tag failures, consent changes, lower demand and checkout errors can all reduce GA4 counts. Shop orders, checkout error logs, automated test runs through checkout and consent-aware tag diagnostics provide independent evidence. Existing orders alone cannot rule out a partial checkout failure.
Can a real decline remain green?
Yes. A small decline may not cross the threshold, and an already weak reference week can conceal a longer problem. Missing references and low volumes are excluded from evaluation rather than labeled healthy. Separate daily checks and several comparable reference weeks can improve coverage.
Does this example send notifications?
No. It writes statuses to the dedicated spreadsheet. Reliable notifications require an additional delivery path, suppression of duplicates and an independent check that the monitor itself is still running.
What still needs validation in the actual account?
Authorization, event availability, API quotas, the trigger, spreadsheet locale and recalculation settings, reference coverage and the visible failure states. Isolated code tests do not substitute for an end-to-end Apps Script and GA4 check.
Sources
- GA4 ecommerce events
- Response schema, 30/60-minute limits and explicit minute ranges
- Minute windows and realtime data model
- Advanced service must be enabled, method mapping
- Installable triggers, creator authorization and timing
- Authorization and trigger identity
- Streaming export exists; within-minutes best-effort data with gaps
- Looker Studio data freshness and the Google Sheets connector
Related articles