English
 Deutsch
 Polski
Changing Bass with Saturation: How Harmonics and Distortion Arise

Management Summary
Saturation is deliberate distortion used to shape the character of music. It can add overtones, higher tones related to the original note, which may make a deep bass more noticeable on small speakers. Stronger processing also changes the sound more, and treating several instruments together can create additional tones between them. The examples explain these trade-offs without ranking pleasantness: the useful amount depends on the music, playback system and intended character.
Contents
Saturation changes the shape of an audio waveform. This can create additional frequencies, including components above an 808’s low fundamental. This experiment examines nine curves in FFmpeg’s asoftclip: which harmonics appear, how distortion rises with input gain, and which mixing frequencies two simultaneous tones produce. Descriptions such as “warm” or “rough” are not assessed by listening tests here.
A transfer curve maps each input value to an output value. Harmonics occur at whole-number multiples of the fundamental: for a 100 Hz fundamental, H2 is 200 Hz and H3 is 300 Hz. RMS measures average signal strength; THD combines the harmonic energies and compares their resulting strength with the fundamental.
The original series dates from 23 September 2026 and uses FFmpeg 7.1.5 and NumPy. All results were reproduced during review. Additional checks clarify two limitations: the original DC-offset test included unintended clipping before tanh, and the 150 Hz boundary cuts through a spectral line. Results apply to these settings, not arbitrary saturation plugins.
How it was measured
A 100 Hz sine starts with a peak of 0.5, half digital full scale. Drive is the gain before the filter. At 0 dB the peak remains 0.5; at +6 dB it is about 0.998; at +18 dB about 3.97. The threshold setting remains 1.0. Exactly reaching that mark requires +6.02 dB; soft curves already change the signal below it. An external soxr resampler raises the sample rate from 48 to 192 kHz and then returns it to 48 kHz. This four-times oversampling reduces aliasing, or frequencies incorrectly folded back into the output, without guaranteeing its complete elimination.
Analysis uses the middle two seconds of each three-second signal. An FFT separates frequency components; a Blackman–Harris window attenuates the section edges. H1 is the fundamental, H2 the second harmonic or first overtone, and H3 the third harmonic or second overtone. Harmonic levels in dB are relative to H1. THD is the combined RMS amplitude of H2 through H20 divided by that of H1. Further tests use DC offset, a steady 50 Hz sine as a simplified bass model, and 60 Hz plus 7 kHz tones at a 4:1 amplitude ratio.
Odd transfer curves and harmonic components
At the tested settings, the curves obey f(−x) = −f(x): positive and negative inputs receive opposite, equal-magnitude outputs. A pure sine without DC offset therefore retains half-wave symmetry. In the ideal model, only odd harmonics appear. Measured H2, H4, H6 and H8 sit about 159 to 178 dB below the fundamental, among very small numerical residuals. This does not establish that every remaining odd harmonic is audible.
| Curve | THD at +9 dB | H3 | H5 | H7 | H9 |
|---|---|---|---|---|---|
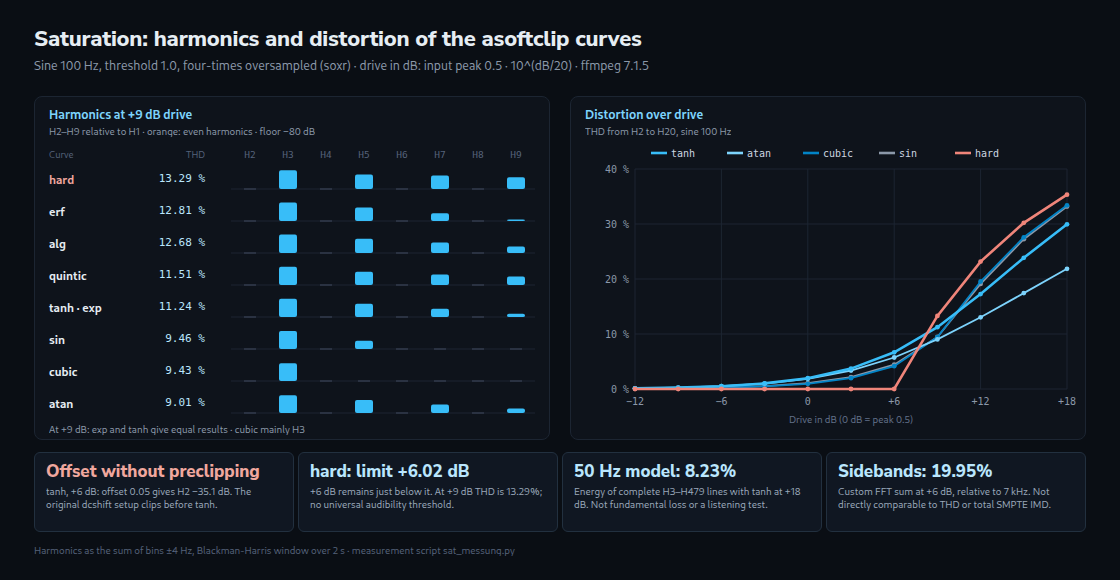
| hard | 13.29 % | −17.8 dB | −31.6 dB | −34.9 dB | −41.0 dB |
| erf | 12.81 % | −17.9 dB | −35.4 dB | −54.4 dB | −75.0 dB |
| alg | 12.68 % | −18.1 dB | −32.3 dB | −45.5 dB | −58.2 dB |
| quintic | 11.51 % | −18.9 dB | −35.7 dB | −45.3 dB | −51.3 dB |
| tanh and exp | 11.24 % | −19.1 dB | −36.0 dB | −52.7 dB | −69.4 dB |
| sin | 9.46 % | −20.5 dB | −52.2 dB | −90.6 dB | −133.9 dB |
| cubic | 9.43 % | −20.5 dB | < −160 dB | < −160 dB | < −160 dB |
| atan | 9.01 % | −21.0 dB | −36.9 dB | −51.3 dB | −65.0 dB |
At +9 dB, hard produces relatively strong higher harmonics: H9 is at −41 dB, compared with −69 dB for tanh. cubic mainly produces H3 in this case because the input peak is still below its internal limit of 1.5. At higher drive, its subsequent clipping creates additional harmonics. The similar THD of cubic and sin describes different spectra but does not prove an audible difference. exp and tanh produce identical measured values in this series. Their formulas agree mathematically for tanh with param=1; this does not equate other parameter settings or all numerical rounding.
Asymmetry: the original test and a corrected check
DC offset shifts a waveform up or down. A symmetric curve then treats the two half-waves differently, allowing even harmonics to appear. The original setup used dcshift before tanh at +6 dB drive. A check shows that dcshift already clips at 1.0 here. An offset of 0.05 would produce a peak of 1.048, but the actual peak is 1.0. The test therefore measures offset plus preceding clipping, not tanh asymmetry alone.
In the original chain, H2 rises to −33.7 dB at offset 0.05 and −14.2 dB at 0.4. A corrected check adds the same offset without preceding clipping. H2 then measures about −35.1 dB at 0.05, −29.1 at 0.1, −23.1 at 0.2 and −17.3 at 0.4. THD rises from 6.68 to 14.52 percent; the subsequent 5 Hz high-pass remains unchanged. A bias control is one possible implementation, not a requirement for every plugin. Increasing drive alone cannot create even harmonics from a pure sine through an ideal odd curve.
How fast distortion rises
At low drive, tanh THD approximately doubles for each 3 dB of added input gain: 0.13 percent at −12 dB, 0.52 at −6 dB and 1.96 at 0 dB. The absolute amplitude of H3 grows approximately with the cube of input amplitude; the H3/H1 ratio grows with its square. At larger inputs this approximation fails: THD is 6.68 percent at +6 dB, 17.25 at +12 dB and 29.95 at +18 dB.
At 0 dB, cubic and sin produce less THD than tanh: 0.95 and 1.06 percent. At +12 dB they exceed tanh, reaching 19.55 and 19.12 percent. Of the five tested drive curves, atan has the lowest result at +18 dB, 21.86 percent. hard does not clip below its limit; +6 dB remains just below it. At +9 dB the measured THD is 13.29 percent, and at +18 dB 35.32 percent. The transfer curve has a corner, but an arbitrarily small threshold crossing does not immediately produce a large distortion jump.
The 808 on small speakers
With standard A4 = 440 Hz tuning, G1 is about 49 Hz and A1 is 55 Hz. A bass tuned to those frequencies has H3 near 147 or 165 Hz and H5 near 245 or 275 Hz. Small speakers may strongly attenuate the fundamental; higher components can help make the bass perceptible. This depends on the device, signal and playback level. The Note to Frequency and MIDI Converter helps locate the frequencies. This experiment uses a steady 50 Hz sine, not a complete 808 with attack, pitch movement and decay.
| Drive | tanh: share above 150 Hz | hard: share above 150 Hz | Fundamental fraction of output, tanh |
|---|---|---|---|
| 0 dB | −40.2 dB (0.01 %) | < 0.0001 % | −0.00 dB |
| +6 dB | −29.4 dB (0.11 %) | < 0.0001 % | −0.02 dB |
| +12 dB | −20.8 dB (0.84 %) | −18.3 dB (1.49 %) | −0.13 dB |
| +18 dB | −15.0 dB (3.18 %) | −13.1 dB (4.89 %) | −0.37 dB |
The table sums FFT energy strictly above 150 Hz and divides by total output energy. H3 of a 50 Hz tone lies exactly at that boundary; the analysis window spreads the line across neighbouring frequency bins. The 3.18 percent result for tanh at +18 dB therefore contains only part of H3. Summing complete H3–H479 lines instead gives 8.23 percent, and for hard 11.10 rather than 4.89 percent. The −0.37 dB figure for tanh is also a fraction: the fundamental contains about 91.8 percent of output energy. It is not a before/after loss of 0.37 dB or a guarantee that the low end remains unchanged.

Intermodulation: the bass distorts the highs too
Nonlinear processing of two tones creates sum and difference frequencies as well as harmonics. Here, 60 Hz at amplitude 0.4 and 7 kHz at amplitude 0.1 are amplified together. This is the usual SMPTE test stimulus. However, this analysis sums only eight sideband regions at 7 kHz ± 60, 120, 180 and 240 Hz, expressing their combined RMS amplitude relative to the 7 kHz tone. It is a defined FFT sideband metric, not a demonstrated standards-compliant SMPTE measurement. For tanh it gives 1.41 percent at −6 dB, 5.47 at 0 dB, 19.95 at +6 dB and 60.63 at +12 dB.
At +6 dB this sideband result is numerically about three times the 100 Hz single-tone THD. The metrics use different signals and references; that does not mean three times as much audible distortion. Saturating the bass separately prevents cross-products between it and other tracks in that processing stage. A later nonlinear master processor can create those products again.
What follows for production
| Goal | Finding | Setting |
|---|---|---|
| Gentle processing | At small inputs, tanh THD rises approximately quadratically | Gradual drive increases; comparison at matched listening levels |
| Create H2 | Asymmetry can produce H2; offset 0.05 without preceding clipping gives −35.1 dB here | Separate checks of asymmetry and DC offset |
| Higher bass components | Saturation creates harmonics above the fundamental | Checks on the target device, output level and low end |
| Stronger high harmonics | hard has H9 at −41 dB with +9 dB drive | Control of drive and aliasing |
| Limit mixing products | Two tones produce additional sidebands | Separate bass processing; checks on later master processing |
Context and limitations
The pure asoftclip curves transform each sample using a fixed formula. Resampling and the high-pass in this setup additionally depend on neighbouring samples. Real devices may also respond differently across frequencies or depend on previous signal states; for example, transformer magnetisation depends on its history. A static sine test does not fully represent such effects. Music can produce numerous mixing products; their number or audibility was not determined here.
Questions and answers
Why does the distortion of tanh double with every 3 dB at low drive?
For small inputs, tanh can be approximated by tanh(x) ≈ x − x³/3. For a sine of peak A, the cubic term produces an H3 amplitude of approximately A³/12, while H1 remains approximately A. Their ratio is therefore about A²/12. H3 largely determines THD in this region.
About +6 dB doubles A and thus approximately quadruples THD; about +3 dB doubles THD. At −12 dB drive, A is about 0.126 and the approximation gives 0.13 percent. At −6 dB, A is about 0.251, giving 0.52 percent. At 0 dB the approximation gives 2.08 percent versus 1.96 measured: higher terms already matter.
With larger inputs, tanh increasingly limits output amplitude. The simple A²/12 approximation is no longer sufficient. The measurements still show rising THD, but not an unchanged quadratic rise.
Why not simply boost the 808’s overtones with an EQ?
A linear EQ changes existing frequency components but cannot create new harmonics from a single sine. A real 808 sample can already contain higher components, whose balance an EQ can change. The pure 50 Hz wave tested here acquires additional harmonics through nonlinear processing.
When is a high-pass useful after asymmetric saturation?
Asymmetry can produce DC offset. The quadratic example sin²(ωt) = (1 − cos(2ωt))/2 contains both a constant component and a doubled frequency. Even harmonics do not require a remaining DC component, however: it can be removed separately or compensated internally.
DC offset shifts the waveform away from zero and can reduce the margin to clipping on one side. Transitions at the start, end or edits can then click. The bias test uses a subsequent 5 Hz high-pass to attenuate very slow or constant components. An additional high-pass is not universally required; its effect on wanted low frequencies also needs checking.
Sources
- FFmpeg 7.1.5 asoftclip source — curves, internal limits and parameters.
- FFmpeg 7.1.5 filter documentation — asoftclip, resampling and high-pass.
- Audio Precision APx500 manual: SMPTE IMD — stimulus and standards-based analysis, distinguished from the custom FFT sum.
- Original measurement: sat_messung.py and audio_hilfe.py; additional checks of clipping in dcshift, offset without preceding clipping, and the 150 Hz band boundary.
Related articles