English
 Deutsch
 Polski
Combining Data in Looker Studio: Avoiding Incorrect Totals and Duplicate Rows

Management Summary
Looker Studio can combine information from different sources in one report, for example to compare campaign costs with results. This is called data blending. The connection only produces useful figures when matching records describe compatible units, such as one campaign on one day. Otherwise totals or rates can be distorted while still looking plausible. The article explains why the meaning of each row, missing information and the way values are added matter for trustworthy business comparisons.
Jump to the interactive example ↓
Contents
Data blending combines tables from several sources in a chart. A join links their rows using matching values, such as the same date and campaign ID. Plausible totals can still be wrong when a join repeats values, drops unmatched keys or combines incompatible metrics. A reliable review checks both individual keys and totals.
Three stages matter: each table is grouped by its selected dimensions, the resulting rows are joined, and the chart can aggregate the joined result again. Table filters, date ranges and chart filters must also be checked. The final number is not determined by the join type alone.
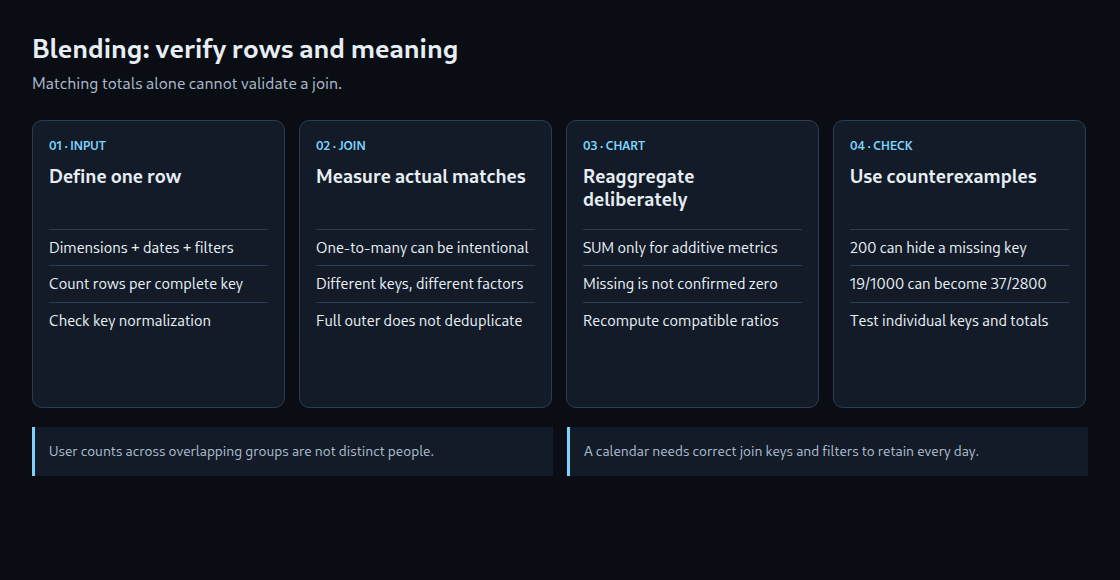
1. Define what one row represents
Before choosing fields, the intended row should be written down: one day, one campaign per day, or one order. The join key must represent that level of detail. A composite key can contain separate date and campaign fields; concatenation is unnecessary.
If one date row contains 100 sessions and matches three campaign rows, the join produces three copies of that session value. A later SUM produces 300. The factor is three only for keys with exactly three matches. Across keys, the total depends on both metric values and match counts.
One-to-many joins are not inherently invalid: a campaign total can intentionally accompany daily detail. The total must then be labelled and aggregated appropriately. AVG or MAX is not a universal deduplication rule and can lose contributions from other campaigns. Reducing both inputs to one row per key is a straightforward option when the chart requires a one-to-one comparison.
2. Choose a join for the reporting question
Left outer retains left-side rows and attaches matches from the right. Right outer reverses that choice. Inner retains matching pairs only. Full outer also retains unmatched rows from either side. Cross combines every row with every other row and requires no key.
Full outer does not prevent repeated values and does not create dates absent from both inputs. A calendar with one row per required date can anchor left joins, provided all joins use that calendar date and later filters do not remove unmatched rows. In a full outer result, the displayed date may need IFNULL(left_date, right_date).
Multiple joins are evaluated in order; later joins operate on earlier results. The first physical table is not the entire left input of every subsequent join. A blend supports at most five tables, including a calendar. Several independent charts can use separate blends; a chart needing more inputs may need upstream preparation.

3. Check keys and effective input rows
Date and date-time fields need compatible types and an explicit reporting timezone. Midnight conversion can place the same event on different days. LOWER and TRIM can normalize campaign labels only when the business meaning permits it. Distinct identifiers must not be merged merely because their formatting looks similar.
A key can be prepared in the source or in a supported table-level calculated field. Calculations inside an individual blend table can reference only that table’s fields. Calculations combining fields from different tables belong after the blend, for example in the chart.
Record Count commonly counts underlying source records, not the number of pre-aggregated join rows. A one-to-one daily join can therefore show a count greater than one. A diagnostic table should expose every selected dimension, count rows per complete key and inspect missing keys. A connector timeout can produce an error; a blank chart alone does not identify the cause.
4. Name fields clearly without changing their meaning
Aliases such as sessions_a and sessions_b make formulas easier to review. The actual source field must still be selected correctly. Identical display names do not by themselves prove that the software silently calculated a wrong sum.
Source metrics can be reaggregated after blending. SUM is suitable for additive values at the intended level; it is not a repair for duplicated rows or distinct-user counts. Automatic aggregation should be understood before being replaced. Two charts can reuse a blend at different levels when the metrics support that change.
5. Separate users, events and ratios
Adding user counts from regional properties counts property memberships, not necessarily distinct people. Likewise, daily distinct-user counts do not establish a monthly distinct count: one person visiting on Monday and Tuesday appears in both daily counts but should count only once for the month. Counts are additive only when the populations are known to be disjoint. Event exports alone do not solve identity across properties: deduplication needs a valid, consistently scoped identifier and a defined identity policy.
For two non-overlapping sources with compatible definitions, a rate can be computed from summed components. In the following example, converted_sessions counts sessions with at least one qualifying outcome. Replacing that numerator with the number of events changes the meaning to events per session and may exceed 100 percent.
Missing values are not automatically zero. A failed import, an unmatched key and a confirmed day without activity have different meanings. The formula below deliberately leaves incomplete data unresolved; zero substitution belongs only where the source contract establishes zero activity.
CASE
  WHEN SUM(
    CASE
      WHEN sessions_a IS NULL OR sessions_b IS NULL
        OR converted_sessions_a IS NULL
        OR converted_sessions_b IS NULL
      THEN 1 ELSE 0
    END
  ) > 0 THEN NULL
  ELSE
    (SUM(converted_sessions_a) + SUM(converted_sessions_b))
    / NULLIF(SUM(sessions_a) + SUM(sessions_b), 0)
END
This chart formula assumes one complete row per shared key in both inputs, disjoint populations, aligned periods and nonnegative session counts. Field names are example aliases. Any incomplete joined row leaves the result empty; a separate completeness check must also detect dates or keys absent from both sources. The numeric output is a fraction, displayed as a percentage.
6. Test with counterexamples
Suppose A has 100 sessions and 10 outcomes, while B has 900 sessions and 9 outcomes. The combined rate is 19/1000 = 1.9%. If A matches once and B three times, a SUM after the join gives 37/2800, about 1.32%. A numerator and denominator from the same source do not preserve the overall rate when match counts differ between keys.
Equal grand totals are not proof of correctness. Original values A=100 and B=100 total 200; a result containing A twice and omitting B also totals 200. The comparison must include key coverage and individual values. Larger or smaller totals are clues, not unique diagnoses: dates, filters, metric scope and source updates can also differ.
A useful acceptance check compares identical date ranges, filters and metric definitions in the original source and the blend, then inspects representative keys, unmatched keys and zero-denominator cases. All joined rows must be evaluated at the intended chart aggregation.
Questions and answers
Does a missing right-hand value become safe when the chart displays zero?
No. Display formatting does not establish a real zero. Match coverage and source completeness should be shown separately, and a ratio should remain unavailable if essential input is unknown.
Why can an extra dimension change a total?
An extra dimension can split a pre-aggregated row into several rows that share the join key. This can repeat a value from the other side. It need not change the number of rows when the new dimension has only one value per key; the actual data determines the effect.
What happens when a chart needs six sources?
The five-table limit applies to one blend, not to the entire report. Separate charts may use separate blends. If all six inputs are required in one calculation, an upstream joined table or view can provide one prepared source. A calendar also occupies a table slot.
Learn by trying
Where did the extra costs come from?
Three campaigns cost 200 € in total. Alpha has two purchases. Join the tables and watch what happens when you sum the costs.
Campaigns and costs
Alpha   100 €
Beta     60 €
Gamma    40 €
Individual purchases and revenue
Alpha / P1   80 €
Alpha / P2  120 €
Beta  / P3   90 €
| Campaign | Cost | Revenue |
|---|
- Sum of cost rows
- Sum of revenue
The join key is the campaign. Without aggregation, the purchase ID remains a dimension: Alpha produces two matching rows, repeating its cost. INNER JOIN excludes Gamma with no purchase even after aggregation. — marks a missing value; empty revenue fields are skipped when summing. This fixed example explains join cardinality and granularity; it does not query Looker Studio.
This module runs in your browser and does not send or store your input.
Learn by trying
One minute: can you spot the mistake?
Alpha costs 100 € and has two purchases. After joining to individual purchases, you sum the cost rows. What is the total for Alpha alone?
Both purchase rows carry the cost: 100 € + 100 €. Aggregate purchases to campaign level first if each campaign’s cost should enter the sum once.
Find the bug
Explore
Find the bug
A problem, two clues and your decision. Examine the clues first, then see what your fix changes.
- The problem
- Examine the clues
- Test a fix
Open both clues before choosing a fix.
PNG with settings, result and article link. Created locally only when you click.
These exercises calculate in your browser. The learning module does not send your answers.
Find the hidden problems
Simplified learning model
Find the hidden problems
Each example hides three problems. Click a suspicious area and explain your suspicion.
Choose an area. Is it a problem, or is it fine in this example?
Fictional, deliberately simplified examples. Each area gives its full context; this does not assess your own website or devices.
These examples run only in your browser. No real systems are disrupted.
PNG with settings, result and article link. Created locally only when you click.
Related articles