English
 Deutsch
 Polski
Analysing Google Ads and Meta Ads Together: Building a Looker Studio Dashboard

Management Summary
A shared dashboard brings Google Ads and Meta Ads results into one reporting view, making advertising budgets easier to oversee. Looker Studio can combine the figures so that spending and trends can be compared across platforms. Costs are comparable only when currencies and reporting periods align. Sales need special care: both platforms may claim the same order. Their reported revenue therefore cannot simply be added to establish the company’s actual sales.
Contents
A shared Google Ads and Meta Ads dashboard can make total advertising spend easier to inspect. Combining platform-attributed conversions is a different task: both platforms may claim the same purchase. A date join cannot deduplicate that purchase. This tutorial therefore separates a spend overview from clearly labelled, non-deduplicated platform ratios.
1. Comparable daily inputs
The Google Ads connector provides the Google-side data. Meta data can arrive through a selected third-party connector or a maintained export. Connector access, supported fields, refresh behavior and any fees need evaluation; a generic claim of certification is not a quality check.
For this example, each platform contributes date, spend, a specifically selected purchase count and the corresponding purchase value. A generic Meta Results field is not automatically a comparable purchase count. The Google conversion selection must also exclude unrelated actions such as newsletter signups. API field mapping and attribution settings belong in the data-source documentation.
All monetary fields, including spend, need the same currency and a documented conversion rule. Dates need a consistent reporting-day definition. Attribution windows, click/view inclusion, conversion date versus interaction date, refunds and update delays can still differ. These differences remain visible in the dashboard description.
2. One row per reporting day
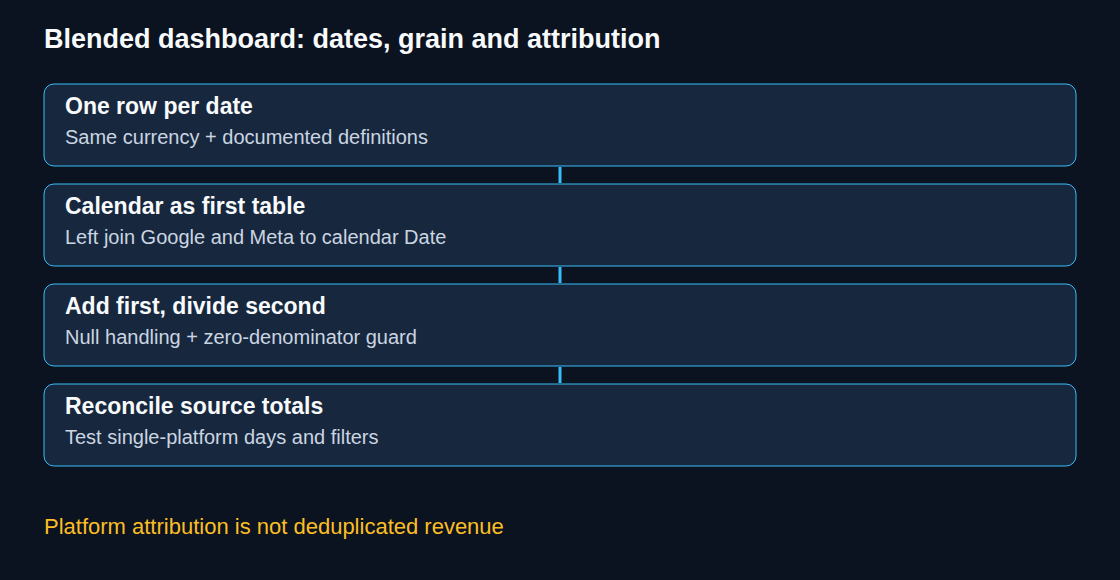
A blend combines data sources into one table; a join matches their rows using a shared field, such as the date. The blend first groups each input by its selected dimensions. For a date-only comparison, each platform table must therefore contain only Date as its grouping dimension, with daily metrics that can be summed, such as spend and purchase counts, rather than daily ratios. Account and campaign filters are applied consistently before the join. Adding Campaign to a table while joining only on Date can multiply matching rows and inflate totals.
Choosing SUM does not cure this multiplication. Native Google Ads metrics can have fixed Auto aggregation; forcing SUM in the source is not always possible. The important check is the resulting table grain and the actual daily totals. In a blend, source metrics can become numbers available for reaggregation in a chart.
3. A calendar preserves all days
Looker Studio supports inner, left outer, right outer, full outer and cross joins. This example deliberately uses left outer joins, with a calendar as the first table. The calendar contains exactly one Date row for every reporting day. Google and Meta each join to the calendar’s Date, rather than Meta joining to a potentially missing Google date.
The chart uses the calendar Date as its date-range dimension. All three tables need compatible date types and date filters. A Meta-only day survives this arrangement; a day with no activity on either platform also remains. A full outer join between the two platforms is another option, but needs a combined date field and does not create days missing from both sources.
4. Ratios calculated from totals
The following names are aliases for numeric fields in the verified daily blend. Each expression belongs in its own chart-specific calculated field; the name is entered separately. One chart-specific calculated field cannot reference another, so each ratio repeats the necessary expressions.
Total spend
IFNULL(SUM(Google_Cost), 0) + IFNULL(SUM(Meta_Spend), 0)Ratio of summed platform-attributed purchase value to spend
(IFNULL(SUM(Google_Purchase_Value), 0) + IFNULL(SUM(Meta_Purchase_Value), 0))
/ NULLIF(IFNULL(SUM(Google_Cost), 0) + IFNULL(SUM(Meta_Spend), 0), 0)
Cost per summed platform-attributed purchase
(IFNULL(SUM(Google_Cost), 0) + IFNULL(SUM(Meta_Spend), 0))
/ NULLIF(IFNULL(SUM(Google_Purchases), 0) + IFNULL(SUM(Meta_Purchases), 0), 0)
IFNULL treats a missing matched row as zero only after the source has been confirmed complete and the missing row means no activity. A failed connector or incomplete export must be shown as missing data, not zero spend. NULLIF makes a zero denominator undefined; the scorecard should display no value, not a misleading zero CPA or ROAS. The formula editor must use the actual blend fields, not arbitrary typed labels.
5. Validation before presentation
A daily detail table should include each platform’s spend, purchase count and value. Source totals and blended totals must match for the same filters and period. Useful checks include a Google-only day, a Meta-only day, a day with zero spend, a day with no purchases and a month boundary. Filter changes need the same checks because pre-join and post-join filtering can produce different results.
The top row can show total spend and separate platform purchase figures. Any combined ratio needs the label “claimed by the platforms; the same purchase may be counted twice”. Refresh timestamps and incomplete-source indicators should remain visible. Actual business revenue or a deduplicated cross-channel return needs order-level data, a consistent attribution rule and reconciliation; a shared order ID alone does not resolve every attribution question.
Questions and answers
Why not average the platform ROAS values?
With costs of €1,000 and €3,000 and attributed values of €4,000 and €6,000, the ratio of totals is €10,000 / €4,000 = 2.5. The simple average of 4 and 2 is 3 and weights unequal budgets equally. The €10,000 is summed platform-attributed value, not proof of €10,000 in unique business revenue. The same ratio-of-totals principle applies across days.
Can a note fix different account time zones?
A note explains the limitation but does not align the data. Daily totals cannot generally be shifted accurately into another time zone without finer-grained timestamps or appropriately prepared source data. Monthly differences are not guaranteed to be small, especially around range boundaries and concentrated campaigns.
Sources
- Google Data Studio: How blends work
- Google Data Studio: Blending tips and advanced concepts
- Google Data Studio: About calculated fields
- Google Data Studio: NULLIF
- Google Data Studio: IFNULL
- Google Data Studio: Connect to Google Ads
- Google Data Studio: Dimension and metric improvements
- Meta Business SDK: AdsInsights fields
- Google Looker documentation – original reference
Related articles