English
 Deutsch
 Polski
Processing Vocals in FL Studio: Arranging Filters, Compression and De-Essing

Management Summary
A vocal chain is a sequence of effects used to prepare a recorded voice for a song. In FL Studio, separate stages can reduce rumble, even out loud and quiet passages, and soften sharp s sounds. Their order matters because one effect changes what the next receives. The aim is a clear, balanced voice that fits the music. The examples explain these interactions; the useful effects and settings depend on the recording, rather than a fixed recipe for every singer.
Contents
- How the measurements were made
- 1. Dedicated mixer track and recording preparation
- 2. Pitch correction when needed
- 3. Reducing low-frequency interference with a high-pass
- What changes with a high-pass before this compressor
- 4. Compression in Fruity Limiter’s COMP tab
- 5. Targeted sibilance reduction
- De-esser before or after compression: settings also matter
- 6. Further tone processing only when needed
- Reverb and delay through send tracks
- Example division of processing tasks
- Shared vocal bus and final checks
- Limits of the experiment
- Questions and answers
- Sources
A vocal chain is a sequence of effects for a vocal track. A high-pass filter reduces low-frequency interference, a compressor controls level differences, and a de-esser reduces strong sibilants. A dedicated FL Studio mixer track with ten effect slots keeps these tasks organised. Not every recording needs every effect.
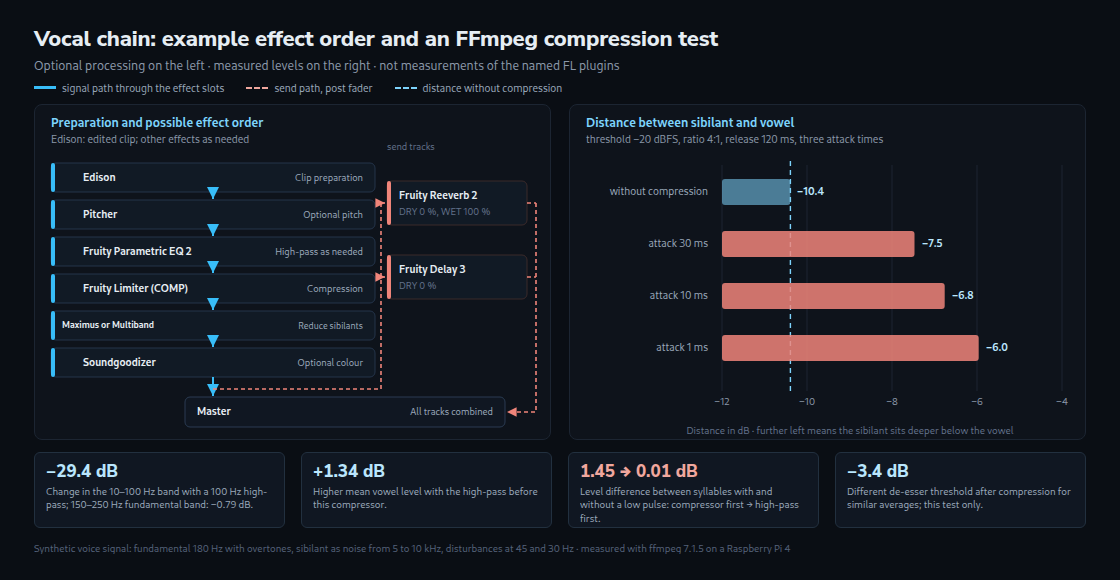
This example combines FL Studio manual guidance with measurements of an artificial voice-like signal in FFmpeg. The measurements cover high-pass filtering, compression and de-essing. Pitcher, Edison, reverb, delay and Soundgoodizer were not measured. The figures describe this test setup; suitable settings still depend on the recording and the intended sound.
How the measurements were made
- Signal: 24 seconds of mono audio at 48 kHz, containing 48 identically structured syllables. Each syllable has a 300 ms vowel, 120 ms sibilant and 80 ms pause. The vowel contains a 180 Hz fundamental and harmonics up to 4.5 kHz: integer multiples of the fundamental. Peak levels are −12 dBFS for the vowel and −18 dBFS for the 5–10 kHz sibilant noise. A continuous 45 Hz tone and a brief 30 Hz pulse every two seconds model low-frequency interference and a microphone air blast. The combined signal peaks at −1.86 dBFS. 0 dBFS denotes digital full scale; negative values are below that reference.
- Effects: FFmpeg 7.1.5. The high-pass consists of two cascaded second-order filters, falling by approximately 24 dB per octave far below cutoff. Attenuation at cutoff is approximately 6 dB. Compressor: −20 dBFS threshold, 4:1 ratio, knee=6, 120 ms release, RMS detection and no makeup gain. knee=6 is a parameter value, not 6 dB. De-esser: dynamic equaliser at 7 kHz with Q=1.4, ratio=4 and 1 ms attack. Q describes bandwidth; ratio in this filter is a gain factor, not a 4:1 compression ratio.
- Analysis: Fourier analysis separates frequency bands. RMS level, a measure of average signal strength, is calculated from each band. The vowel measurement uses 150 Hz–4 kHz from 50 to 280 ms of each syllable; the sibilant measurement uses 5–10 kHz from 310 to 410 ms. RMS values are averaged linearly across 48 syllables before conversion to dB. Loudness in LUFS comes from FFmpeg’s ITU-R BS.1770 measurement; a difference in LU describes the change in that reading.
- Scope: FFmpeg filters and compressors are not replicas of the FL plugins. Measured levels are not listening assessments either. Matching control names or numerical settings does not guarantee matching results.
1. Dedicated mixer track and recording preparation
The manual describes 500 mixer insert tracks with ten effect slots each. A dedicated track makes independent vocal processing easier. Recording with sufficient distance below 0 dBFS helps prevent unexpected peaks from clipping; no single target level suits every signal chain. The linked buffer calculator converts buffer sizes and sample rates into time. The lowest reliable setting also depends on the driver, hardware and computer load. Related: latency and buffer calculator
Edison is an audio editor loaded into an effect slot, recording the signal at that point. Cleanup and editing operate on recorded material. The edited clip then returns to the Playlist. Loading Edison alone does not automatically repair a vocal passing through the track. Noise reduction, declicking and clipped-signal repair can help, but cannot replace an undistorted recording.
2. Pitch correction when needed
Pitcher corrects monophonic material, meaning one note at a time, according to a key and scale. Correction speed affects audible note transitions. Formant controls affect vocal colour during pitch changes; unchanged timbre is not guaranteed. MIDI can specify target notes, while Harmonize adds voices.
Image-Line recommends a dry, monophonic input and an early position in the effect path for Pitcher. Reverb, chords and multiple voices make pitch detection harder. This provides a specific reason for early placement, rather than establishing a universal rule that all pitch correction must precede every compressor.
3. Reducing low-frequency interference with a high-pass
An equaliser changes the strength of selected frequency regions. Fruity Parametric EQ 2 offers seven bands, including high-pass filters. A high-pass reduces low frequencies while largely passing higher ones. Slope and filter shape both matter. Even two filters rated at 24 dB per octave can have different attenuation at cutoff. The linear-phase FFT mode adds plugin latency; the standard mode is therefore better suited to a low-latency recording path.
The table below describes the FFmpeg high-pass. The 10–100 Hz band mostly contains the added low-frequency interference; the 150–250 Hz band contains the fundamental. These are whole-signal band RMS readings, not isolated measurements of separate sound sources.
| High-pass | Low band 10–100 Hz | Fundamental band 150–250 Hz | Peak level |
|---|---|---|---|
| none | −20.91 dBFS | −23.96 dBFS | −1.86 dBFS |
| 60 Hz | −34.85 dBFS | −24.06 dBFS | −10.87 dBFS |
| 80 Hz | −43.17 dBFS | −24.29 dBFS | −10.47 dBFS |
| 100 Hz | −50.29 dBFS | −24.75 dBFS | −10.70 dBFS |
| 120 Hz | −56.31 dBFS | −25.53 dBFS | −11.32 dBFS |
| 150 Hz | −63.86 dBFS | −27.38 dBFS | −12.78 dBFS |
At 100 Hz, the low-band level falls by 29.38 dB and the fundamental-band level by 0.79 dB. At 150 Hz, the changes are 42.95 and 3.42 dB. A higher cutoff removes more low-frequency energy here but also weakens the fundamental more. Even 60 Hz reduces the peak level by about 9 dB. This additional distance below full scale exists after processing and cannot repair a recording that already clipped.
No fixed cutoff suits every voice. The useful distinction is between unwanted low-frequency content and content that belongs to the desired vocal sound. Half an octave below 180 Hz is approximately 127 Hz, not 120 Hz. That interval is not a universal setting rule either; 100 Hz is simply the comparison setting chosen for this test.
What changes with a high-pass before this compressor
The tested compressor derives its gain reduction from the full input signal. Low-frequency interference can therefore turn down the vowel too. A preceding high-pass reduces that influence. Compressors with a filtered detector signal can behave differently. With otherwise identical settings, the test gives:
| Order | Vowel level | Loudness | Peak level | Dip on plosive syllables |
|---|---|---|---|---|
| High-pass, then compressor | −23.72 dBFS | −25.8 LUFS | −13.61 dBFS | 0.01 dB |
| Compressor, then high-pass | −25.06 dBFS | −27.1 LUFS | −14.16 dBFS | 1.45 dB |
Placing the high-pass first raises the mean vowel level by 1.34 dB and measured loudness by 1.3 LU. With the opposite order, syllables containing the added low pulse average 1.45 dB below the other syllables; with the high-pass first, the difference is 0.01 dB. This is a measured level difference. Whether it sounds like a brief dip was not tested.
4. Compression in Fruity Limiter’s COMP tab
THRESH sets the threshold, RATIO sets the relationship above it, and KNEE shapes the transition into reduction. ATT in COMP affects how quickly compression develops; REL affects its recovery. Very short timings can introduce distortion. SUSTAIN controls averaging in level detection. GAIN amplifies after compression and before limiting. Crucially, the manual states that COMP-ATT does not create lookahead. ATT in the LIMIT tab sets the limiter’s lookahead and associated delay.
The test uses a 4:1 ratio, 10 ms attack and 120 ms release. Such values are comparison starting points, not settings for every singer. Even syllables, preserved consonant onsets and comparison at similar output loudness matter more. The linked sidechain article explains control from another track. Related: sidechain compression in FL Studio
5. Targeted sibilance reduction
A de-esser reduces strong sibilants, such as an intrusive “s”. The relevant region often lies between 4 and 12 kHz, but its position depends on the voice and recording. Unlike a permanent EQ cut, reduction occurs when the processing is triggered. This can better preserve bright material outside the sibilants.
In the Maximus “De-esser Split Band” preset, compression is disabled in the low band: the low-frequency signal remains audible. The high band is off, extending the middle band to 20 kHz; master compression is also disabled. The middle band limits the upper region. PRE GAIN controls the level entering that processing, and POST GAIN compensates afterwards. Fruity Multiband Compressor instead offers three independently processed bands. Crossover frequencies, threshold and timing require adjustment to the recording.
In this test, compression reduces louder vowels more than quieter sibilant sections, bringing their levels closer together. “Difference” in the table means sibilant level minus vowel level; a less negative value means relatively stronger sibilants.
| Processing | Vowel level | Sibilant level | Difference | Change |
|---|---|---|---|---|
| without compression | −19.29 dBFS | −29.68 dBFS | −10.39 dB | reference |
| attack 30 ms | −22.34 dBFS | −29.81 dBFS | −7.47 dB | +2.92 dB |
| attack 10 ms | −23.21 dBFS | −29.97 dBFS | −6.76 dB | +3.63 dB |
| attack 1 ms | −24.50 dBFS | −30.46 dBFS | −5.96 dB | +4.43 dB |
Sibilants lose at most 0.78 dB, while vowels lose up to 5.21 dB. Their separation shrinks by 2.92–4.43 dB relative to the unprocessed signal. This explains a possible increase in relative sibilance despite falling absolute levels. The test alone does not establish audible harshness or a universal effect of fast attack.

De-esser before or after compression: settings also matter
A second test adjusts the de-esser threshold separately for each position. Both aim to restore the original mean sibilant-minus-vowel difference of −10.39 dB. Other settings remain the same:
| Position | Adjusted test threshold | Final sibilant level | Final vowel level |
|---|---|---|---|
| De-esser before the compressor | −41.8 dB | −34.16 dBFS | −23.77 dBFS |
| De-esser after the compressor | −45.2 dB | −34.24 dBFS | −23.85 dBFS |
With these adjusted thresholds, final levels are within 0.09 dB of one another. After compression, the required threshold is 3.4 dB lower in this test. Moving an effect without adjusting its controls does not establish whether both positions can achieve a similar balance. Equal averages do not prove identical waveforms or equal processing of every syllable.
Both positions are possible. After compression, de-essing can address the balance already changed by the compressor; before compression, it can reduce strong sibilants at the input. Threshold and release need comparison within the complete effect path. These results do not support a general release recommendation of 5–40 ms.
6. Further tone processing only when needed
Soundgoodizer uses the Maximus engine and blends the input with processed outputs from its three compressor bands. Presets A–D define different processing. It is therefore not a pure saturation effect. Extra tone processing may suit a recording, but is neither mandatory nor necessarily the final step in a vocal chain.
Sibilants merit another check after further dynamics processing or distortion. Nonlinear distortion can create additional harmonics. Soundgoodizer and saturation were not measured in this experiment.
Reverb and delay through send tracks
A send track provides an additional parallel effect path: the dry voice remains audible while a copy receives reverb or delay. This allows independent settings and shared ambience for several tracks. Reverb and delay can also work as inserts with a suitable dry/wet blend. Mixer sends follow the fader; Fruity Send permits an earlier tap in the effect path.
For a dedicated reverb send, the Fruity Reeverb 2 manual specifies DRY 0% and WET 100%. This avoids adding another dry voice through the reverb return. DELAY shifts the start of reflections. DEC describes a 60 dB decay relative to the start of the reverberation, not an absolute target of −60 dBFS. Filtering and damping shape the reverb tail.
A dedicated Fruity Delay 3 echo send also needs its output DRY control at 0%. Delay time can be set in milliseconds or synchronised to tempo. Sixteen steps equal one bar in the usual 4/4 setup, not in every time signature. For mono input, the manual also requires an appropriate PAN setting for Ping Pong repeats to alternate sides. The BPM calculator provides corresponding time values. Related: BPM and delay calculator

Example division of processing tasks
| Stage | Plugin | Task | Example / note |
|---|---|---|---|
| Preparation | Edison | Clip editing | Only when needed; edited clip returned to the Playlist |
| Optional | Pitcher | Pitch correction | Key and correction suited to the recording |
| Optional | Fruity Parametric EQ 2 | Low interference | Cutoff suited to voice and interference |
| Optional | Fruity Limiter (COMP) | Level control | Test: 4:1, 10 ms attack, 120 ms release |
| Optional | Maximus / Multiband Compressor | Sibilance | Band, threshold and timing suited to the signal |
| Optional | Soundgoodizer | Tone and dynamics | Preset and blend suited to the intended sound |
| Send | Fruity Reeverb 2 | Reverb | DRY 0%, WET 100% |
| Send | Fruity Delay 3 | Echo | Output DRY 0%; tempo-related timing |
Shared vocal bus and final checks
Several vocal tracks can feed a common bus. Additional compression is optional. Routing should avoid accidentally sending the vocals to the master both directly and through the bus. LUFS describes measured loudness; true peak also estimates peaks between stored samples. Both help assess the finished signal. Whole-mix correlation or mid/side readings do not prove that an individual voice is centred; the isolated track, pan position and left/right levels also matter. The linked mastering article covers the completed mix. Related: LUFS and true peak meter · tool for stereo correlation and mid/side · mastering to streaming loudness
Limits of the experiment
- FFmpeg filters and FL plugins work differently. Maximus in particular offers freely shaped transfer curves. The figures here are not measurements of the named FL plugins or directly transferable presets.
- The artificial signal has regularly spaced syllables, no room sound, no breaths and no vibrato. Real recordings can show larger, smaller or different effects of processing order.
- The high-pass comparison applies to this signal with its 180 Hz fundamental and added interference. Other voices, filter shapes and interference spectra change the outcome. Sharp frequency-band separation in the analysis can also affect time-domain behaviour.
- At an unchanged threshold, an additional test with 40 ms release gives sibilant reductions of 19.40 dB before and 5.15 dB after compression. At 5 ms, the results are 15.19 and 15.32 dB. At 200 ms, vowel levels also fall by 5.34 and 3.21 dB respectively. The cause of the large 40 ms difference was not isolated. The result is reproduced, but does not justify a general recommendation for that release time.
- Operating details come from Image-Line’s manual. Practical testing of these FL plugins and listening comparisons are outside the measurement.
Questions and answers
Why does a syllable stay quieter when a later high-pass removes the low pulse?
In the test, the low pulse has already triggered stronger gain reduction in the compressor. Recovery takes time, so the reduction also affects the vowel. A later high-pass removes low-frequency energy without undoing the gain reduction already applied. The measured difference between affected and other syllables averages 1.45 dB.
Can vocal-bus compression bring sibilants forward again?
It can, but not inevitably. The result depends on which signal components trigger reduction and how long that reduction lasts. Vowels receive more reduction than sibilants in the single-track test. This does not establish a fixed change per decibel of bus compression, especially when several voices overlap.
The final sibilance check therefore includes the bus and later effects. An additional bus de-esser can help; processing individual troublesome tracks may work just as well. The summed signal needs its own assessment rather than automatically stronger settings.
Which effects add delay while recording vocals?
Linear-phase EQ and lookahead limiting can add delay. In Fruity Limiter, LIMIT-ATT is relevant, not COMP-ATT. Other plugins and the audio driver can contribute too. Plugin latency readings and a test of the actual recording path provide more information than a list of only two supposed causes.
Delay compensation aligns existing tracks during playback. It cannot make a delayed live voice reach the headphones earlier. A lean recording path with low-latency effects can help; further processing can be added after recording.
Sources
- Image-Line: Mixer – effect slots, buses and send routing.
- Image-Line: Fruity Parametric EQ 2 – filter shapes and FFT-mode latency.
- Image-Line: Fruity Limiter – separate COMP and LIMIT attack functions and signal flow.
- Image-Line: De-Essing Options in FL Studio – frequency-dependent sibilance processing.
- Image-Line: Maximus Tutorials – structure of the split-band de-esser preset.
- Image-Line: Fruity Multiband Compressor – three frequency bands and their processing.
- Image-Line: Fruity Reeverb 2 – send settings and relative decay time.
- Image-Line: Fruity Delay 3 – timing, dry output and ping-pong operation.
- Image-Line: Pitcher – monophonic input, pitch correction and Harmonize.
- Image-Line: Soundgoodizer – blending the processed Maximus bands.
- Image-Line: Edison – recording and editing audio clips.
- FFmpeg 7.1.5 – filter parameters used in the reproduced test.
Related articles