English
 Deutsch
 Polski
Loudness Matching With Reference Tracks in FL Studio: Methods, Routing and Measurement Limits

Management Summary
A reference track helps judge the sound of a music mix, but a louder recording can seem better simply because of its level. Loudness matching reduces that bias before comparing bass balance, drum impact and stereo width in FL Studio. Matching the highest peaks is not enough, and comparing entire songs answers a different question from comparing their choruses. The reference also needs to avoid effects intended for the mix. Similar measured loudness supports fairer listening without making the recordings sound identical.
Jump to the interactive example ↓
Contents
- How this was measured
- Why peak level fails as a yardstick
- Matching by loudness, and what it demands
- Which section gets compared matters
- How exact the match has to be
- The reference track in FL Studio
- What is left to compare once loudness matches
- What this covers and what it does not
- Questions and answers
- Sources
A reference track provides a comparison for tone, dynamics and stereo balance. A level difference can bias that judgment: louder audio can seem more impressive. Matching measured loudness reduces this bias, but does not make different recordings sound identical or equally loud at every instant.
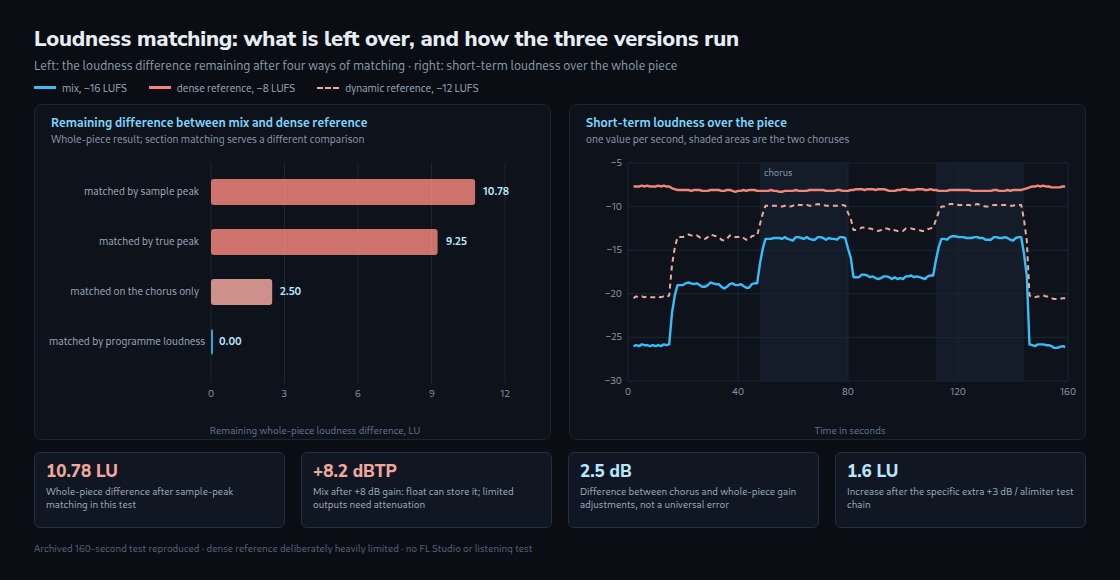
This experiment uses a synthetic 160-second piece in three processed versions: a mix without limiting at −16 LUFS, a heavily limited reference at −8 LUFS and a more dynamic reference at −12 LUFS. LUFS describes frequency-weighted loudness relative to digital full scale; LU expresses a difference between loudness readings. The test compares peak matching, whole-piece matching, section matching and extra processing of the reference.
A sample peak is the largest stored value, expressed in dBFS with 0 at digital full scale. True peak estimates the reconstructed waveform’s maximum in dBTP. FFT splits a signal into frequency components; third-octave bands group them into frequency ranges. The median is the middle value after sorting the readings.
How this was measured
- Signal: 120 BPM, 44.1 kHz stereo, with intro, two verses, two choruses and outro. Each section changes instrumentation and level. The archived waveform and measurement scripts are the evidence for the numbers; this is not a representative sample of commercial releases.
- Versions: the mix is the source scaled to −16 LUFS. The two references use FFmpeg alimiter plus level adjustment, reaching −8 and −12 LUFS with measured true peaks around −1.05 dBTP. The dense example required +39.77 dB drive relative to the quiet raw source and a −2.58 dBFS limiter ceiling: an intentionally extreme test, not a standard mastering recipe.
- Measurement: FFmpeg 7.1.5 ebur128 reports integrated loudness and LRA. Integrated loudness summarises the selected interval with very quiet blocks excluded by gating; short-term loudness uses a moving three-second window. The chart retains one short-term value per second. LRA follows EBU Tech 3342, not BS.1770 alone. A separate four-phase filter estimates true peak, including peaks between samples; no new compliance certification is claimed.
- Spectrum: the script first averages left and right, then averages FFT power over 16,384-sample windows and sums it into third-octave bands. These are mono-sum bands, not the sum of stereo-channel energy; opposite-phase content can cancel. A +2 dB high shelf test gave +1.94 dB at 10.2 kHz and +2.08 dB at 16.1 kHz. This checks that example, not every analyser error.
- Scope: the principle that equal peaks need not mean equal loudness follows from the different measurements. The particular numerical gaps and spectral changes depend on this signal and its processing.
Why peak level fails as a yardstick
The same musical source produces different loudness, variation and peaks after processing:
| Version | Loudness | Loudness range | Short-term, median | Sample peak | True peak |
|---|---|---|---|---|---|
| Mix, without limiter | −16.0 LUFS | 12.4 LU | −18.0 LUFS | +0.20 dBFS | +0.20 dBTP |
| Reference, dense | −8.0 LUFS | 0.5 LU | −8.1 LUFS | −2.58 dBFS | −1.05 dBTP |
| Reference, dynamic | −12.0 LUFS | 10.6 LU | −12.6 LUFS | −2.27 dBFS | −1.05 dBTP |
The dense version measures 8 LU above the mix despite having lower peaks. Matching sample peaks leaves 10.78 LU difference in whole-piece loudness; matching true peaks leaves 9.25 LU. A peak meter answers how high the largest peak is, not how loud the programme is on average.
LRA is 12.4 LU for the mix and 0.5 LU for the dense reference. LRA is a gated statistical range of short-term loudness, excluding extreme low and high portions of the distribution. A small LRA indicates little variation in the retained central range; it does not prove that every instant is equally loud or that transients, the brief attacks at the start of sounds, have disappeared.
Matching by loudness, and what it demands
| Way of matching | Remaining against the dense reference | Remaining against the dynamic reference |
|---|---|---|
| by sample peak | 10.78 LU | 6.47 LU |
| by true peak | 9.25 LU | 5.25 LU |
| by loudness of the chorus only | 2.50 LU | 0.20 LU |
| by programme loudness of the whole piece | 0 LU | 0 LU |
Whole-piece matching reaches equal integrated readings in this example. Raising the mix by 8 dB would also raise its true peak from +0.2 to about +8.2 dBTP. A floating-point file can store such values, but an output with limited range can clip. A practical comparison therefore lowers the louder reference by 8 dB and gives both paths enough additional output headroom. The original mix already exceeds full scale slightly. Raising a quieter signal is possible when sufficient headroom exists; “never turn up the mix” is not a general rule.
The comparison level and the final delivery target are separate decisions. A comparison should preserve the intended mix processing and avoid clipping in either path.
Which section gets compared matters
The sections have different loudness relationships. A whole-piece match helps compare overall level; a match over corresponding choruses helps compare those choruses. The chosen interval must be stated:
| Section | Mix | Reference, dense | Reference, dynamic |
|---|---|---|---|
| Verse 1 | −19.0 LUFS | −8.1 LUFS | −13.5 LUFS |
| Chorus 1 | −13.7 LUFS | −8.2 LUFS | −9.9 LUFS |
| Outro | −26.0 LUFS | −7.7 LUFS | −20.4 LUFS |
| whole piece | −16.0 LUFS | −8.0 LUFS | −12.0 LUFS |
For whole-piece matching the dense reference is lowered by 8 dB. Matching chorus 1 alone calls for about 5.5 dB attenuation instead, leaving the reference 2.5 LU higher over the whole piece. Matching verse 1 calls for about 10.9 dB attenuation, leaving the reference 2.9 LU lower overall. Those are changes of comparison basis, not proof that section matching is always wrong.
For the dynamic reference, chorus-based and whole-piece adjustments differ by only 0.2 dB here. Other arrangements can produce different gaps. No listening experiment measured whether or how strongly the differences are perceived.
How exact the match has to be
EBU R 128 allows ±0.2 LU for measurement errors in loudness workflows and ±1 LU where the target is impractical, such as live programmes. These are broadcast-workflow tolerances, not a music A/B hearing threshold. For this comparison, using the same meter, interval and processing state makes the result reproducible. A close numerical match is useful, but small differences in perception can remain.
The reference track in FL Studio
In FL Studio, the reference audio clip needs its own Mixer track. A useful routing arrangement sends the production tracks through a dedicated mix bus containing their master processing, then to a clean final output; the reference goes separately to that final output. Unwanted direct or duplicate sends must be disabled. A separate hardware output is another option, but is not inherently required for this arrangement. Both paths must reach the same monitoring conditions.
The archived test adds 3 dB before a −1 dBFS alimiter to illustrate what happens when the reference is processed again. This is one test chain, not a definition of a typical master chain:
| Reference through the master chain | Loudness before | Loudness after | True peak after |
|---|---|---|---|
| dense reference, no drive | −8.0 LUFS | −8.0 LUFS | −1.05 dBTP |
| dense reference, 3 dB of drive | −8.0 LUFS | −6.4 LUFS | +0.53 dBTP |
| dynamic reference, 3 dB of drive | −12.0 LUFS | −9.8 LUFS | +0.40 dBTP |
With no extra drive, the measured reference metrics were unchanged because the sample peaks stayed below this limiter’s ceiling. Adding 3 dB increased integrated loudness by 1.6 LU for the dense version and 2.2 LU for the dynamic one. Other effects can alter a reference even below a limiter threshold. The reference should bypass processing intended only for the mix. Disabling that processing for both signals would also change the mix being assessed.
Wave Candy offers a BS.1770-related metering mode, but its documented moving display should not be assumed to equal a reset, gated whole-programme measurement. An integrated meter must be reset and run over the agreed interval. The meter position also matters: measurement before the reference fader cannot show the fader’s adjustment.
A track fader or a transparent gain utility can both scale level without changing the waveform shape. Either can change later nonlinear processing, so the level adjustment belongs after processing that should remain fixed. The chosen gain, file and measurement interval should be recorded.
What is left to compare once loudness matches
After matching integrated loudness, the mono-sum spectrum still differs. The following values compare the dense reference with the matched mix in this experiment:
| Third-octave band | Reference against mix |
|---|---|
| 10.2 kHz | −3.09 dB |
| 16.1 kHz | −3.09 dB |
| 12.8 kHz | −3.05 dB |
| 126 Hz | −2.57 dB |
| 100 Hz | −2.40 dB |
| 8.1 kHz | −1.97 dB |
The versions share a source, so the differences arose through their processing and subsequent level matching. The values do not isolate a fixed EQ curve of the limiter: gain varies with time and affects differently arranged sections. An automatic inverse EQ based on this table would therefore not necessarily improve the mix. Stereo-channel and mono compatibility checks answer additional questions.
A useful A/B comparison uses corresponding musical sections, quick switches and unchanged monitoring. Similar integrated readings do not erase differences in arrangement, tone, stereo image or local dynamics. Spectral and stereo meters can help locate a difference; listening determines whether a change suits the intended sound.
Related tools and background: true peak after encoding · mastering to streaming loudness · LUFS and true peak meter · vocal chain in FL Studio · tool for stereo correlation and mid/side
What this covers and what it does not
- The synthetic versions share one source. Different recordings can show smaller or larger band differences; these values are neither a lower nor an upper bound.
- The DSP measurements use FFmpeg, not FL Studio plugins. The dense reference is a deliberately severe limiting example.
- Broadcast loudness tolerances are not mandatory music-comparison targets or guarantees of identical perceived loudness.
- The 2.5 and 0.2 dB section-adjustment differences belong to these versions and intervals. Another chorus or arrangement can differ.
- FL Studio routing and Wave Candy descriptions were checked against Image-Line documentation. No FL Studio application test was performed.
Questions and answers
Doesn’t the loudness normalisation of streaming services make matching unnecessary anyway?
Streaming normalisation depends on the service, settings and playback mode. A local A/B match does not automatically reproduce every listener’s playback. It remains useful because it removes one avoidable level difference from the comparison being made.
A simple gain change preserves waveform shape and relative spectral balance. It does not undo limiting or restore lost transients. LRA is usually unchanged under ordinary level shifts, but absolute gating and any extra processing can affect a measured result.
Is an MP3 file good enough as a reference?
An MP3 can be measured for loudness, but it may contain codec artefacts or bandwidth changes. For detailed tonal judgment, a lossless reference such as WAV or FLAC avoids an extra lossy-encoding stage. Lossless does not guarantee that two files use the same master; the source version still matters.
What is the most reliable way to determine the trim value for the reference?
For a whole-piece comparison, the adjustment starts from integrated loudness of the exact two files. For a section comparison, the same agreed type of section is measured in each. A reproducible procedure is:
- The mix is rendered or monitored with its intended processing, while the reference bypasses that processing. The chosen complete intervals are measured without clipping.
- The adjustment is target loudness minus reference loudness. For −16.0 versus −8.0 LUFS, the reference adjustment is −8 dB. Both adjusted outputs then need a check for sufficient peak headroom.
- The record includes file version, interval, meter and gain. Monitoring level stays fixed while switching between signals.
Short-term readings describe the current three-second neighbourhood, not whole-piece integrated loudness. The median of those readings is another statistic: here the mix’s median is −18.0 LUFS while its integrated value is −16.0 LUFS. Neither replaces the other; the measurement must match the comparison question.
Sources
Learn by trying
Equal loudness – but is there enough headroom?
Set source loudness, comparison target and true peak. The required gain also shifts the peaks.
- Required gain
- True peak after gain
Hypothetical readings, not audio-file analysis or a streaming target. Approximation for pure linear gain on the same passage, without gating changes, limiting or other processing. Positive peaks cannot be preserved in an export to a fixed-ceiling format.
This module runs in your browser and does not send or store your input.
Learn by trying
One minute: can you spot the mistake?
You raise −16 LUFS to −12 LUFS. True peak was −2 dBTP. What does the pure-gain calculation say?
The increase is 4 dB. Without other processing, peaks also rise by 4 dB. For a fair comparison, lower the louder reference instead; raising gain does not manage headroom.
Related articles