English
 Deutsch
 Polski
Linking Google Business Profile to GA4: The Seven Metrics

Contents
Since 8 June 2026, Google Analytics has supported linking a Google Business Profile in Admin under Product links. A dedicated reporting collection appears after linking. The connection brings aggregated profile metrics into GA4; it does not create a person-level link between profile actions and website sessions.
Linking requires an Editor or Administrator role in the Analytics property and Owner or Manager access to the profile. The integration is not supported for subproperties. All listed metrics are shared together; individual metrics cannot be selected. The collection’s appearance does not guarantee that every metric immediately contains usable data.
What the seven metrics mean
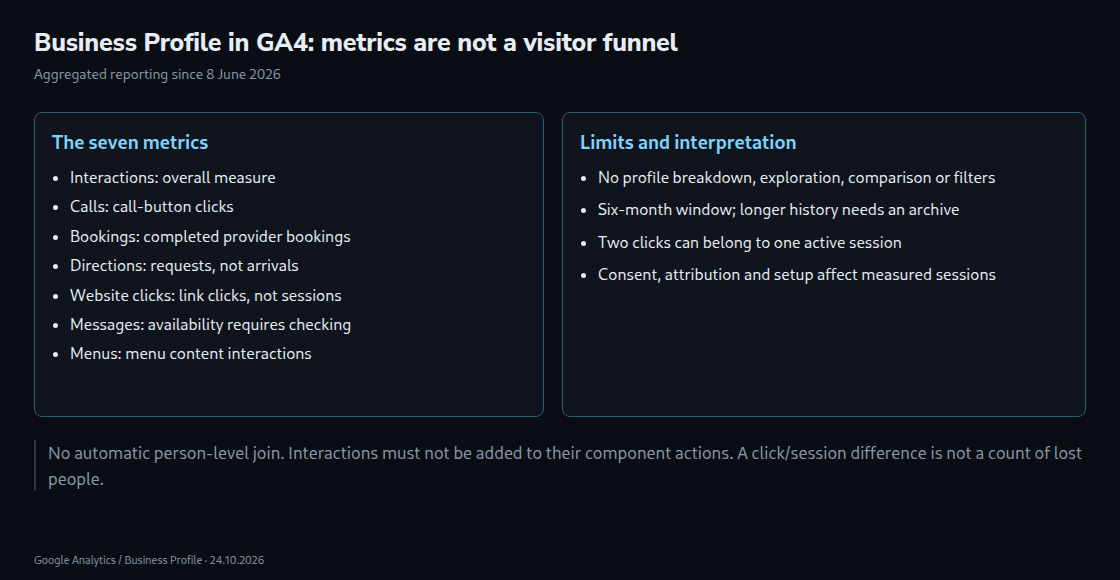
- Interactions: an overall interaction measure, not a seventh independent action to add to the other counts.
- Calls: clicks on the profile’s call button, not confirmed connected calls or sales.
- Bookings: completed bookings through a supported booking provider; availability depends on the setup.
- Directions: requests for directions, not verified arrivals at the business.
- Website clicks: clicks on the profile’s website link, not measured website sessions.
- Messages: a documented metric whose availability needs checking. The former Business Profile chat and its Performance API conversation metric were discontinued in 2024; a report label does not guarantee current message data.
- Menus: interactions with menu content, including photos, links and structured menus, with Google’s per-user, per-day counting rules.
These metrics indicate interest, but not identical outcomes. A call-button click is not automatically more valuable than a page view. GA4 may show metrics that the Business Profile dashboard hides as irrelevant. An empty field therefore needs a definition and availability check before being treated as zero demand.
Clicks minus sessions is not a count of lost people
A profile interaction does not prove that no website visit happened later. Menu links and booking journeys can also lead beyond the profile. Website clicks and sessions measure different things, and repeated clicks can occur within one active session. For example, two clicks during one continuously measured session produce a difference of one without a lost visitor.
Other causes include abandoned page loads, blocked tags, consent configuration, attribution, different reporting periods and processing delays. A redirect that loses campaign parameters can change attribution without removing the session itself. A real implementation fault is also possible; the difference should not be dismissed automatically.
Consent refusal does not always stop all Google measurement. Basic consent mode blocks tags before consent; advanced mode can send cookieless signals while consent is denied, with modelling subject to eligibility. Consequently, a simple subtraction cannot isolate consent refusals or unmeasured individuals.
Three reporting limits
- Limited customization: GBP metrics cannot be used in explorations or comparisons, and filters cannot be applied.
- Combined locations: linked profiles are summed, without a profile-level breakdown in this collection. The total can still support overall monitoring; branch-level questions need another data view.
- Six-month window: the collection exposes the most recent six months. Selecting a longer date range does not recover older data, so a year-on-year comparison needs previously retained data or another suitable source.
These limits do not make analysis impossible. Time trends and aggregate changes remain useful when definitions, availability and the linked profile set stay consistent. Seasonal effects matter, but are not automatically the main cause of every change.
A practical reporting setup
A separately tagged website link can identify campaign traffic, for example https://example.com/?utm_source=google&utm_medium=organic&utm_campaign=business-profile-location-a. A stable campaign value per location helps distinguish measured traffic in acquisition reports. Redirects must preserve these parameters; the destination and recorded campaign dimensions need checking. Tagging does not provide a one-to-one match to the aggregated GBP clicks.
For several locations, the Business Profile performance download can provide location-level data. An authorized Performance API integration is another route for supported metrics. Available API fields must be checked separately; the seven GA4 labels do not imply seven identical API fields. Existing separate properties can be linked appropriately, but creating a property per branch solely to work around this report requires a broader measurement decision.
A regular archive should retain the location, metric definition, period, extraction date and value. Exported periods must not be added repeatedly when windows overlap. A first archive can preserve the currently available history; future exports cannot reconstruct data already unavailable. A monthly spreadsheet is one possible approach, not the only one.
Questions and answers
Can imported calls or bookings be marked as key events?
The aggregate profile metrics do not automatically become GA4 stream events. Separately implemented website, app or offline event measurement can support key events where appropriate. That requires its own definitions and implementation; the profile link alone does not supply that measurement.
Will two clicks always produce one session?
Only when both belong to the same active measured session. Different browsers, devices, identifiers or a timed-out session can produce separate sessions. A new campaign parameter does not establish a unique person-level connection to the profile.
Does this show only organic local traffic?
No. Business Profile performance can include activity from organic results and Google Ads. A manually tagged organic website link does not turn the entire profile dataset into an organic-only measure.
Sources
- Google Analytics developer guide
- Google: Analytics sessions
- Google Analytics: Release notes
- Google Analytics: Business Profile integration
- Google Business Profile: Analytics connection
- Google Business Profile: Performance metrics and downloads
- Google: Chat and call history changes
- Google: Consent mode overview
- Google Analytics: Custom campaign URLs
- Google Business Profile: Performance API
- Google Analytics: Recommended events
Related articles