English
 Deutsch
 Polski
Bare-Metal Performance Diagnostics: Prometheus & Grafana Dashboard for Raspberry Pi
Part 7 of 7 in the series Homelab on the Raspberry Pi

Contents
Architectural Overview: Single-Board Hardware Vulnerabilities
Bare-metal ARM single-board computers such as the Raspberry Pi 4 and 5 operate under tight thermal and I/O constraints. Sustained container workloads, frequent database write cycles, and intense network throughput frequently trigger silent hardware degradation. High SoC temperatures induce dynamic thermal throttling via the Broadcom firmware, reducing ARM clock frequencies without logging explicit errors to user application spaces. Similarly, continuous random write operations on MicroSD cards or USB-connected SSDs lead to flash block exhaustion, read/write I/O bottlenecks, and eventual kernel filesystem corruption.
Implementing a Bare-Metal Performance Diagnostics Pipeline utilizing Prometheus and Grafana transforms opaque hardware states into observable, time-series metrics. By combining the standard node_exporter daemon with a specialized custom textfile collector script, critical Raspberry Pi bare-metal indicators can be scraped every 15 seconds, evaluated for threshold violations, and visualized in real-time dashboards. Those indicators include SoC core temperatures, under-voltage flags, clock frequencies, RAM saturation, and storage I/O wait times; the values supplied by vcgencmd are refreshed once per minute by the scheduled collector script.
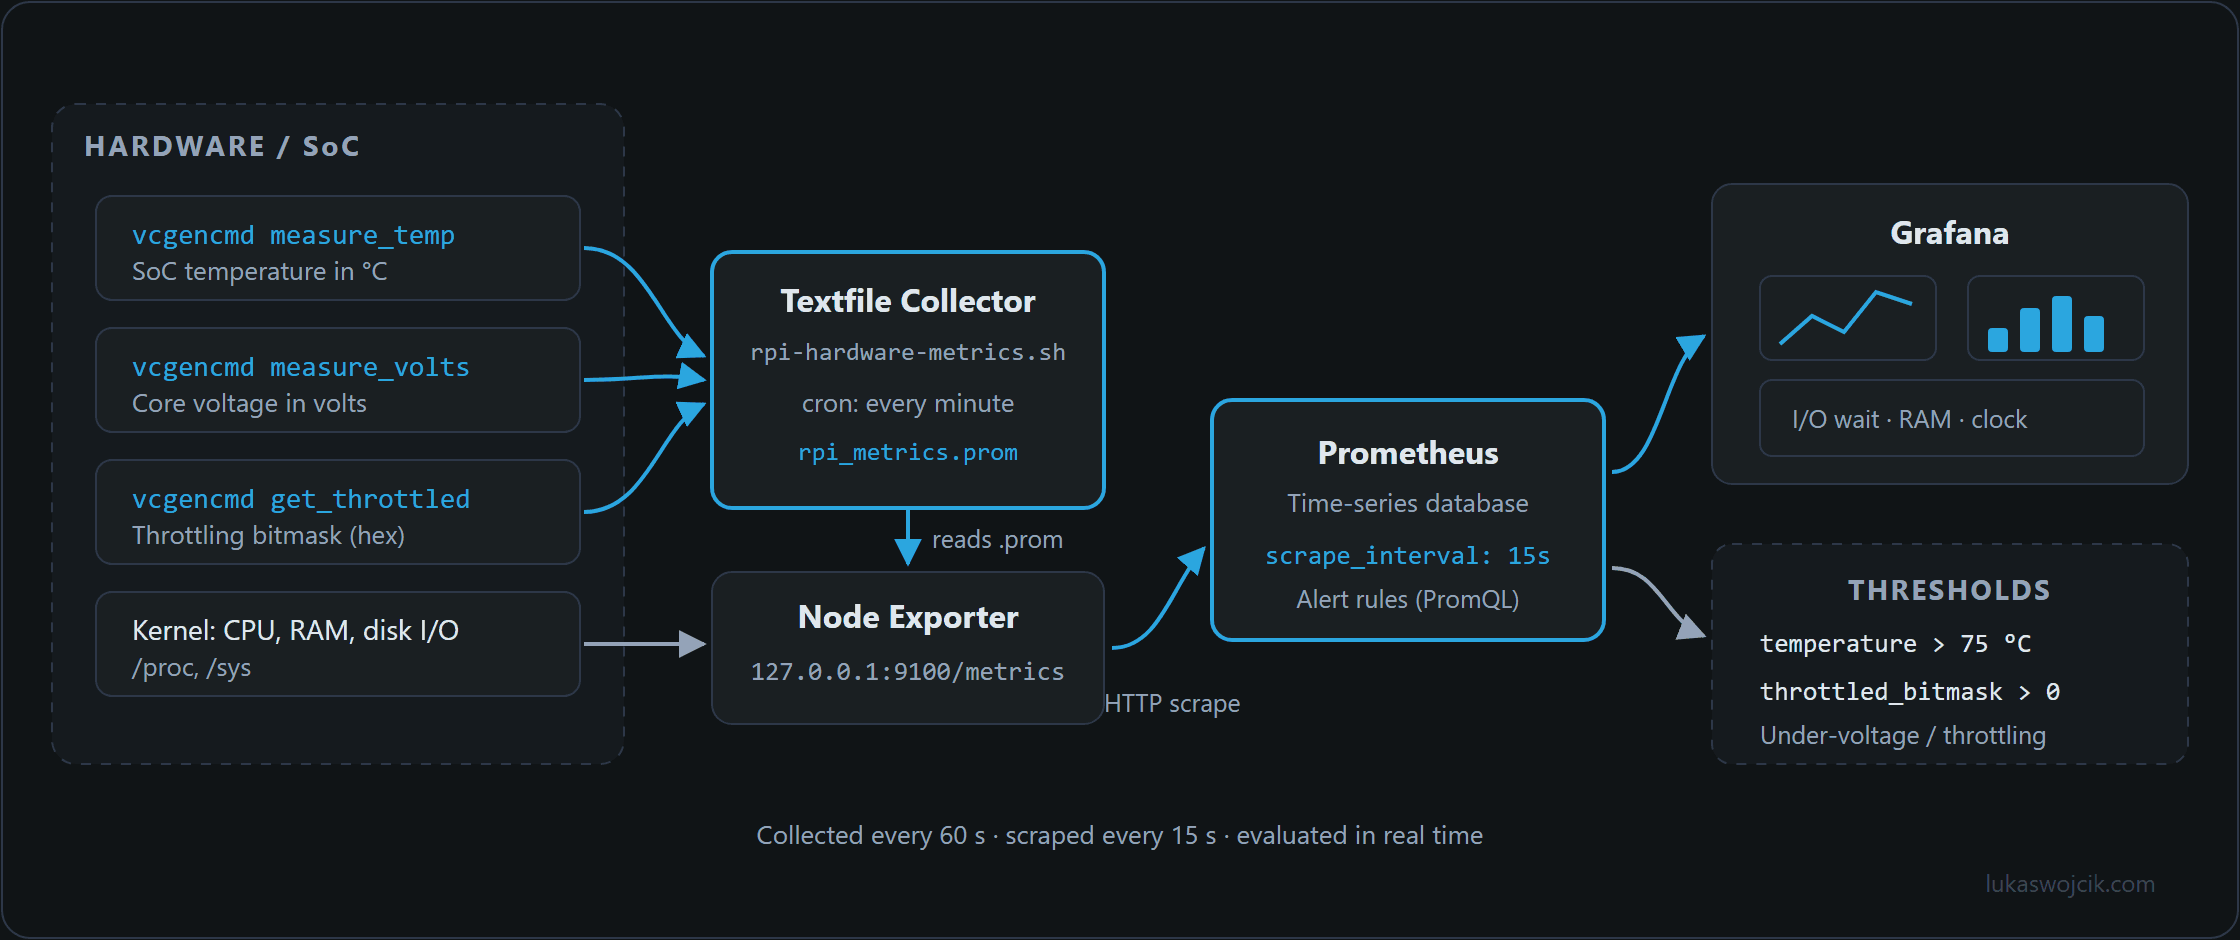
vcgencmd values reach Grafana via the textfile collector, Node Exporter and Prometheus — and trigger an alert above 75 °C or when the throttling bitmask is non-zero.Step-by-Step Implementation Guide
Step 1: Deploying Node Exporter and the Raspberry Pi Textfile Collector
To capture standard Linux kernel telemetry alongside proprietary Broadcom hardware statistics, install node_exporter and create a dedicated directory for custom metric textfiles:
apt update && apt install -y prometheus-node-exporter
mkdir -p /var/lib/node_exporter/textfile_collector
chmod 755 /var/lib/node_exporter/textfile_collector
Create a custom bash script at /opt/scripts/rpi-hardware-metrics.sh to extract SoC temperature, core voltage, and hardware throttling flags using vcgencmd:
#!/usr/bin/env bash
# /opt/scripts/rpi-hardware-metrics.sh
# Extracts bare-metal SoC metrics for Prometheus textfile collector

TEXTFILE_DIR="/var/lib/node_exporter/textfile_collector"
TMP_FILE="$TEXTFILE_DIR/rpi_metrics.prom.$$"
FINAL_FILE="$TEXTFILE_DIR/rpi_metrics.prom"

# 1. Extract CPU Core Temperature (degrees Celsius)
TEMP_C=$(vcgencmd measure_temp | grep -oE '[0-9]+([.][0-9]+)?')
echo "# HELP rpi_soc_temperature_celsius Broadcom SoC Core Temperature" > "$TMP_FILE"
echo "# TYPE rpi_soc_temperature_celsius gauge" >> "$TMP_FILE"
echo "rpi_soc_temperature_celsius $TEMP_C" >> "$TMP_FILE"

# 2. Extract SoC Core Voltage (Volts)
VOLT_V=$(vcgencmd measure_volts core | grep -oE '[0-9]+([.][0-9]+)?')
echo "# HELP rpi_soc_core_voltage_volts Broadcom SoC Core Voltage" >> "$TMP_FILE"
echo "# TYPE rpi_soc_core_voltage_volts gauge" >> "$TMP_FILE"
echo "rpi_soc_core_voltage_volts $VOLT_V" >> "$TMP_FILE"

# 3. Extract Throttling Hex Code as integer bitmask
THROTTLE_HEX=$(vcgencmd get_throttled | cut -d'=' -f2)
THROTTLE_DEC=$((THROTTLE_HEX))
echo "# HELP rpi_soc_throttled_bitmask Bitmask representing under-voltage or thermal throttling flags" >> "$TMP_FILE"
echo "# TYPE rpi_soc_throttled_bitmask gauge" >> "$TMP_FILE"
echo "rpi_soc_throttled_bitmask $THROTTLE_DEC" >> "$TMP_FILE"

mv "$TMP_FILE" "$FINAL_FILE"
Make the script executable and schedule execution every minute via crontab:
chmod +x /opt/scripts/rpi-hardware-metrics.sh
(crontab -l 2>/dev/null; echo "* * * * * /bin/bash /opt/scripts/rpi-hardware-metrics.sh >/dev/null 2>&1") | crontab -
Step 2: Reconfiguring Node Exporter Systemd Service
Modify the systemd service file for node_exporter to instruct it to read metrics from the custom textfile directory:
# /etc/default/prometheus-node-exporter
ARGS="--collector.textfile.directory=/var/lib/node_exporter/textfile_collector --collector.filesystem.mount-points-exclude='^/(dev|proc|sys|run)($|/)'"
Restart the service to apply the flags: systemctl restart prometheus-node-exporter.
Step 3: Configuring the Prometheus Time-Series Scraper
Deploy Prometheus using Docker Compose with network_mode: host and configure a 15-second scraping interval pointing to the local node exporter target:
# /opt/containers/prometheus/prometheus.yml
global:
  scrape_interval: 15s
  evaluation_interval: 15s

scrape_configs:
  - job_name: 'raspberry_pi_baremetal'
    static_configs:
      - targets: ['127.0.0.1:9100']
        labels:
          instance: 'rpi5-homelab'
Step 4: Deploying Grafana and Importing Bare-Metal Panels
Launch Grafana via Docker Compose, also with network_mode: host, connect the Prometheus database (http://127.0.0.1:9090) as the default data source, and create dashboard panels utilizing the following PromQL queries:
- SoC Core Temperature Panel:
rpi_soc_temperature_celsius(Alert threshold configured at > 75°C). - Under-Voltage & Throttling Alert:
rpi_soc_throttled_bitmask > 0(Indicates inadequate power supplies or severe overheating, now or at any point since the last boot; stays active until the next reboot). - Storage I/O Utilization:
rate(node_disk_io_time_seconds_total[1m]) * 100(Detects flash controller bottlenecks and worn storage blocks). - RAM Availability Rate:
(node_memory_MemAvailable_bytes / node_memory_MemTotal_bytes) * 100.
Step 5: Quality Assurance and Stress Testing
To confirm that the telemetry pipeline accurately captures hardware exhaustion, stress-testing validation must be performed:
- Synthetic I/O Stress Validation: Execute an intensive disk benchmark using
fio(e.g.,fio --name=test --ioengine=libaio --rw=randwrite --bs=4k --size=1G) and verify that the Grafana I/O Wait panel shows real-time storage latency spikes. - Thermal Throttling Simulation: Stress all ARM CPU cores via
stress-ng --cpu 4 --timeout 120swhile monitoringrpi_soc_temperature_celsiusin Prometheus to confirm accurate temperature tracking up to cooling fan activation thresholds. - Textfile Metric Parsing Audit: Execute
curl -s http://127.0.0.1:9100/metrics | grep rpi_in the terminal to verify that custom voltage and throttling metrics are cleanly exposed without formatting syntax errors.
Summary and Measurable Added Value
What is achieved: Deployment of an autonomous bare-metal hardware diagnostic pipeline on Raspberry Pi hardware using Prometheus time-series scraping, custom SoC textfile collectors, and Grafana monitoring dashboards.
Resulting added value:
- Early Detection of Storage Failure: Continuous monitoring of disk I/O wait times and flash wear allows preventative SD card or SSD replacement before catastrophic filesystem corruption occurs.
- Prevention of Thermal Throttling: Real-time visibility into SoC temperatures and throttling bitmasks guarantees that containerized services run at maximum clock frequency without silent performance degradation.
- Power Supply Quality Control: Immediate logging of under-voltage flags (bit 0,
bitmask 0x1) identifies failing USB-C power adapters or excessive peripheral power draw before hardware crashes occur.
Questions and answers
Why does the throttling alert stay active until the next reboot after a single incident?
Because get_throttled returns two kinds of bits. The lower bits describe the current state, among them bit 0 for under-voltage and bit 2 for throttling. The bits from 16 upward record that the same thing has happened at some point since boot, and they stay set until the Raspberry Pi restarts. A brief voltage dip in the morning therefore yields something like 0x50000 (under-voltage and throttling have occurred), 327680 in decimal, and this value stays above zero for the rest of the day.
For evaluation it pays to separate the two. PromQL supports the % operator, and rpi_soc_throttled_bitmask % 16 > 0 checks only the four lower bits, meaning the current state; rpi_soc_throttled_bitmask >= 65536 reports that something has happened since boot. Clearer still is to have the script write a separate metric for each bit.
Then there is the script’s timing: it runs once a minute, and get_throttled only reports the state at that moment. Throttling lasting a few seconds between two runs does not show up in the lower bits, but it does in the bits from 16 upward. For brief under-voltage in particular, the recorded part is therefore the more reliable one.
Can Prometheus in a container reach the target 127.0.0.1:9100?
Only with network_mode: host. In a regular Docker network, 127.0.0.1 is the container itself, while node_exporter runs outside it directly on the host, so the target stays down permanently. The same applies to Grafana: if both containers share a Docker network, the data source address uses the name of the Prometheus service instead of 127.0.0.1.
Homelab on the Raspberry Pi
- Raspberry Pi 4 and 5: Booting From an SSD by Changing the Bootloader
- Uninterruptible Power Supply (UPS) for Raspberry Pi 4 and 5: Top 5 Solutions for High-Load Setups
- Local CI/CD for Raspberry Pi: Automating Docker Compose Deployments
- Autonomous Docker-Compose Home Server with Traefik, SSL, and Watchtower
- Zero-Latency Local Media Server: Jellyfin on Raspberry Pi 5 with Hardware Acceleration
- Raspberry Pi as a Hardened WireGuard VPN Gateway with Split-Tunneling
- Bare-Metal Performance Diagnostics: Prometheus & Grafana Dashboard for Raspberry Pi
Related articles