English
 Deutsch
 Polski
GA4 User Metrics: How Total, Active, New and Returning Users Are Defined

Contents
Google Analytics reports four numbers for the same question: how many people were here. Total users, active users, new users and returning users sit beside each other in the same reports, and the names suggest four slices of one pie. The reference page defines them one after another and then adds a note that quietly takes the arithmetic apart.
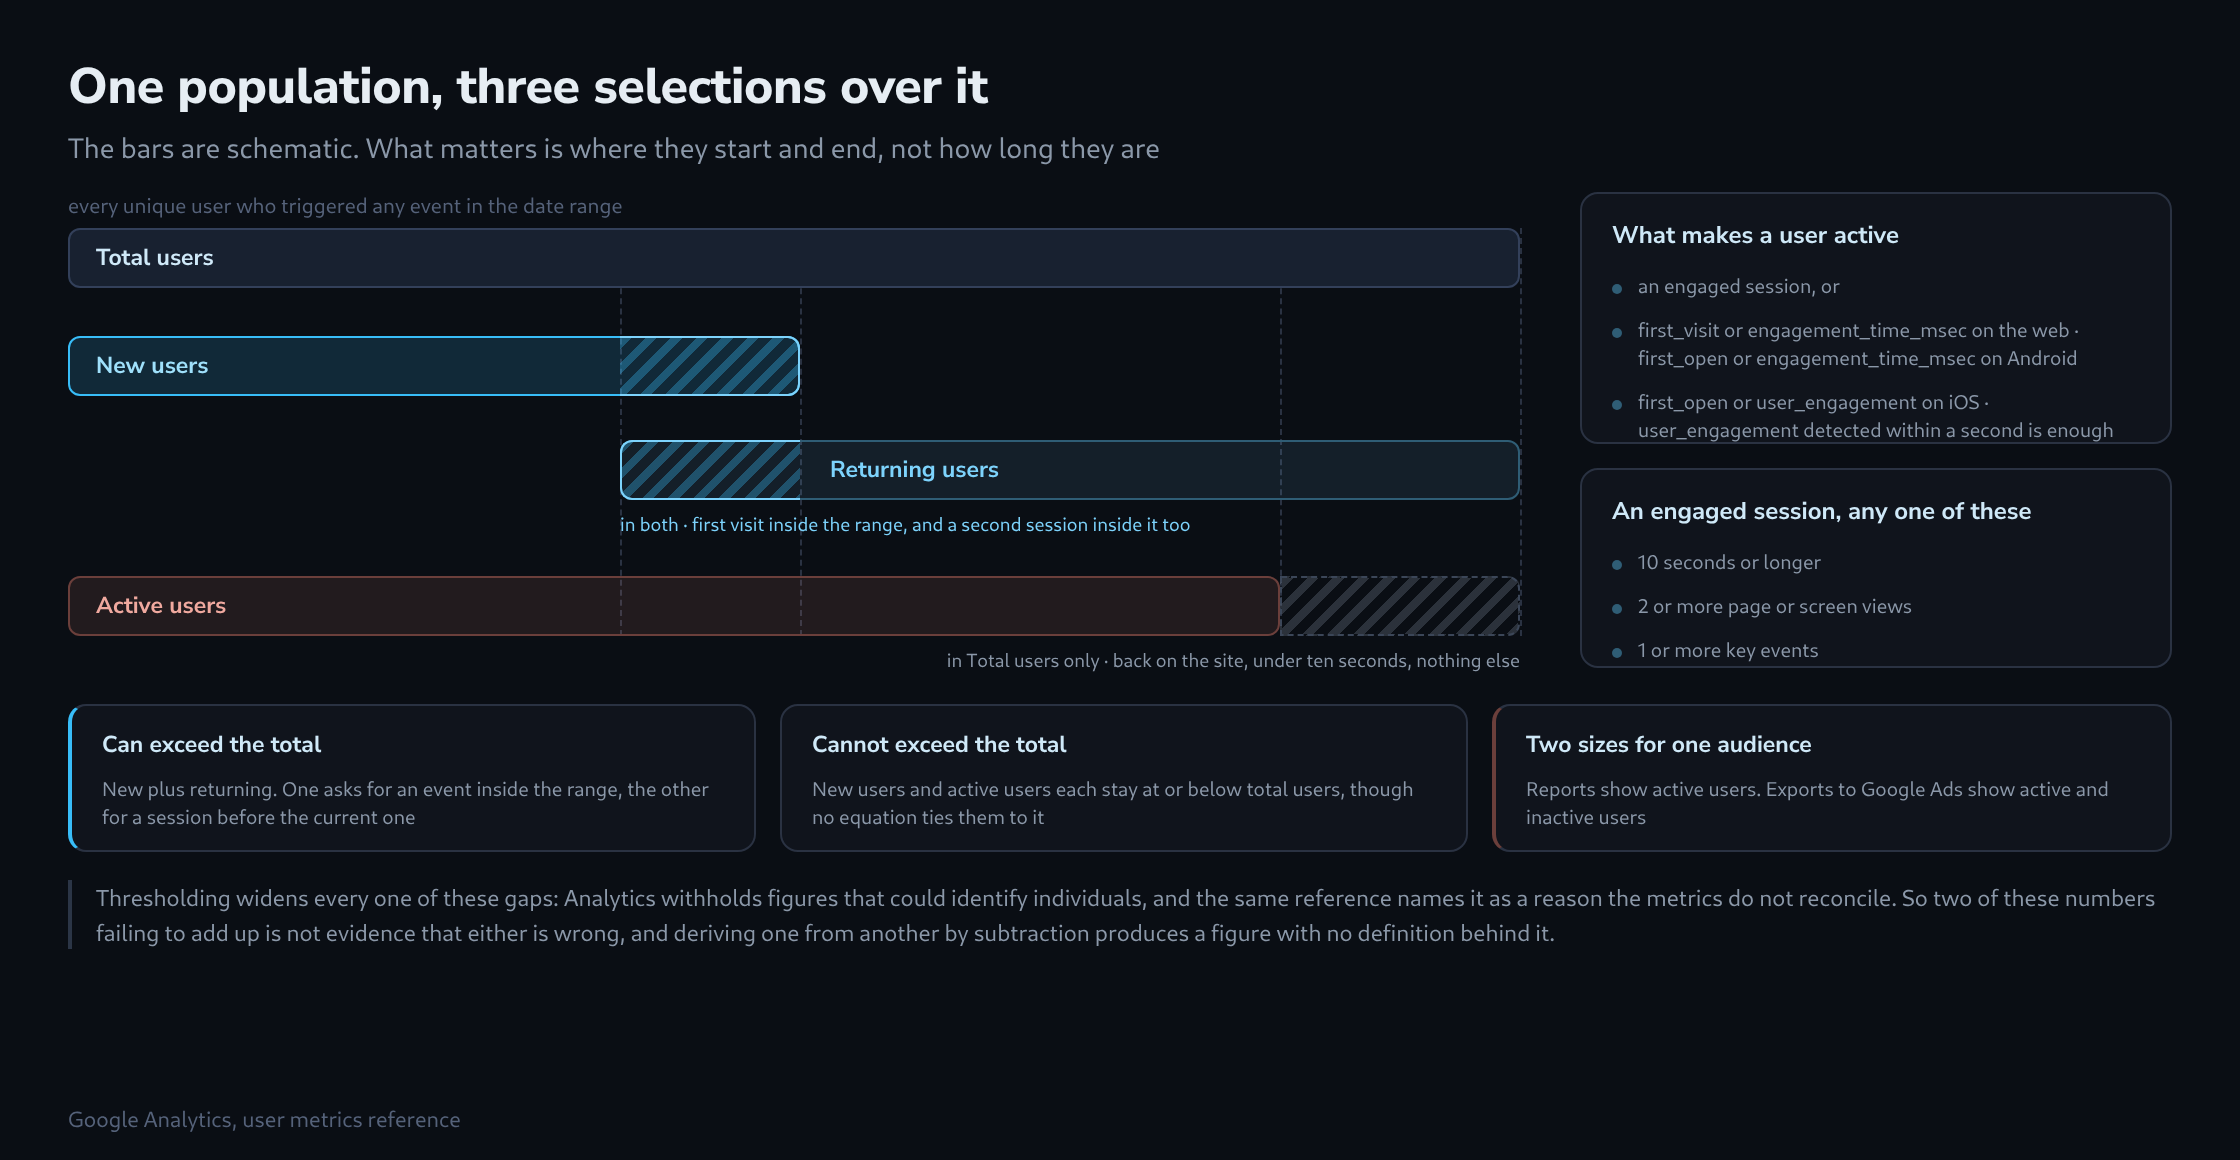
The four figures do not add up to a total. Total users counts the whole population, while the other three metrics each select a group from it. Two of those groups can include the same person within a single date range.
The four definitions, read closely
Total users is the number of unique users who triggered any event in the date range. Any event at all, so a single page_view from a visitor who left at once is enough to be counted.
New users is the number of unique users who logged first_open or first_visit in the date range.
Returning users is the number of unique users who initiated at least one previous session, whether or not that earlier session was an engaged one.
Active users is the number of unique users who engaged with the site or app. That means anyone with an engaged session, or from whom Analytics collected first_visit or the engagement_time_msec parameter on the web, first_open or engagement_time_msec on Android, first_open or user_engagement on iOS. The reference adds that a user counts as active as soon as user_engagement is detected within a second.
Why new plus returning can exceed the total
The two definitions are anchored differently. New users looks for an event inside the date range. Returning users looks for a session before the current one, and that earlier session may lie inside the same range. As soon as the range covers more than one day, a single person can satisfy both conditions.
date range: Monday to Tuesday, three visitors

A   first visit Monday, reads for 40 seconds
    comes back Tuesday, reads two more pages
      first_visit inside the range .... New users
      a previous session .............. Returning users

B   first visit Tuesday, one page, closes it
      first_visit inside the range .... New users

C   last here in July, back on Tuesday
    leaves after 6 seconds, nothing else
      a previous session .............. Returning users
      no engaged session, no first_visit
                                      . not among Active users

Total users        3
New users          2      A, B
Returning users    2      A, C
                   ---
the two added      4      one more than there are people
Visitor A is genuinely both, under the published definitions, and no error has occurred. The consequence is practical: subtracting new users from total users does not produce returning users, and a chart that stacks the two into a total is drawing a quantity that has no definition behind it.
The ten-second rule underneath active users
An engaged session is a session that lasted 10 seconds or longer, or had 1 or more key events, or had 2 or more page or screen views. Any one of the three is enough, and that rule is what decides the active users figure for everybody who is not on a first visit.
The reference names the case where the numbers come apart. A person who has been on the site before opens it again, stays under ten seconds and does nothing else. That person meets none of the criteria for being active and is counted in total users only.
Which makes active users sensitive to something that has nothing to do with traffic: what the site does in its first ten seconds. A page that loads faster, a consent banner that no longer holds the visitor still, a redirect that adds a second page view — each of them moves the figure without a single extra visitor arriving.

Where one audience has two sizes
The reference is explicit on this point: reports show active users, while exports to Google Ads show both active and inactive users. The same audience read in two places legitimately returns two numbers, and the difference between them consists of people who arrived and did nothing measurable.
Thresholding widens the gap further. Analytics withholds figures that could make individuals identifiable, and the same page names that as a reason these metrics do not reconcile. Two numbers failing to add up to a third is therefore not evidence that either is wrong.
What remains is a shape rather than an equation: new users and active users each stay at or below total users, and nothing more than that is guaranteed. The page states plainly that not all new users are active and that new users may exceed active users.
Which of the four answers which question
Reach, meaning how many distinct people the site touched at all, is total users. It is the widest figure and the only one with no engagement condition attached, which makes it the right denominator for coverage questions and the wrong one for anything about quality.
Acquisition is new users, and it is the only one of the four tied to a single named event rather than to a condition. That makes it the most stable of the four over long periods and the least likely to shift when something changes in the front end.
Retention is returning users, with the caveat written into the definition: it says nothing about whether the return was worth anything, because it explicitly ignores whether the previous session was engaged.
Everything else belongs to active users, the figure the standard reports lead with and therefore the one most people mean when they say traffic. Reading a fall in it as a fall in visits is the mistake worth avoiding. The first thing to put beside it is total users: if the total held while active fell, nobody stopped coming, and something changed in what happens during the first ten seconds.
Questions and answers
Active users fell after a relaunch while total users held steady. What is the likely cause?
Almost always something in the first ten seconds, not the traffic. If the total holds, the same number of people arrived; fewer of them meet one of the three criteria for an engaged session. Three places are worth checking, in this order:
- Page views per session. An old redirect that triggered a second page_view turned every such session into an engaged one. If it disappears with the relaunch, active users fall although nothing about the visits has changed. The same happens when a single-page application stops sending a page_view on route changes after the rebuild.
- Key events. A single one is enough for a session to count as engaged. If a form or click event no longer fires after the rebuild, everyone who stayed under ten seconds and counted as active only because of that event drops out.
- Time on the page itself. A faster page that shows the answer at once pushes visits below the ten-second threshold, and so does a consent banner that is dismissed more quickly than the old one. That is not damage but a success, which the metric shows as a decline.
Only when all three look unremarkable is it worth searching for a measurement error in the tag itself.
Which of the four figures belongs in a monthly report?
That depends on the question the report is meant to answer: total users for reach, new users for acquisition and active users for what is usually meant by traffic. New and returning users should not be stacked in one chart, because their sum has no definition.
Can the user figures be reconciled with the server logs?
As a trend, yes; as a number, no. A server log counts requests and IP addresses, including those from crawlers and from visits without JavaScript. GA4 usually counts users through an identifier in the browser and only sees visits on which the tag fires: an ad blocker, missing consent or a deleted cookie shifts the figure without anything changing in the log. Conversely, a single IP address often stands for several people, and a phone changes it several times on the move.
What matters, therefore, is whether both curves rise and fall together. If they drift apart, the cause is worth looking for, such as a tag missing on individual pages.
Related articles