English
 Deutsch
 Polski
Search Console: Telling a Logging Error Apart From a Real Drop

Contents
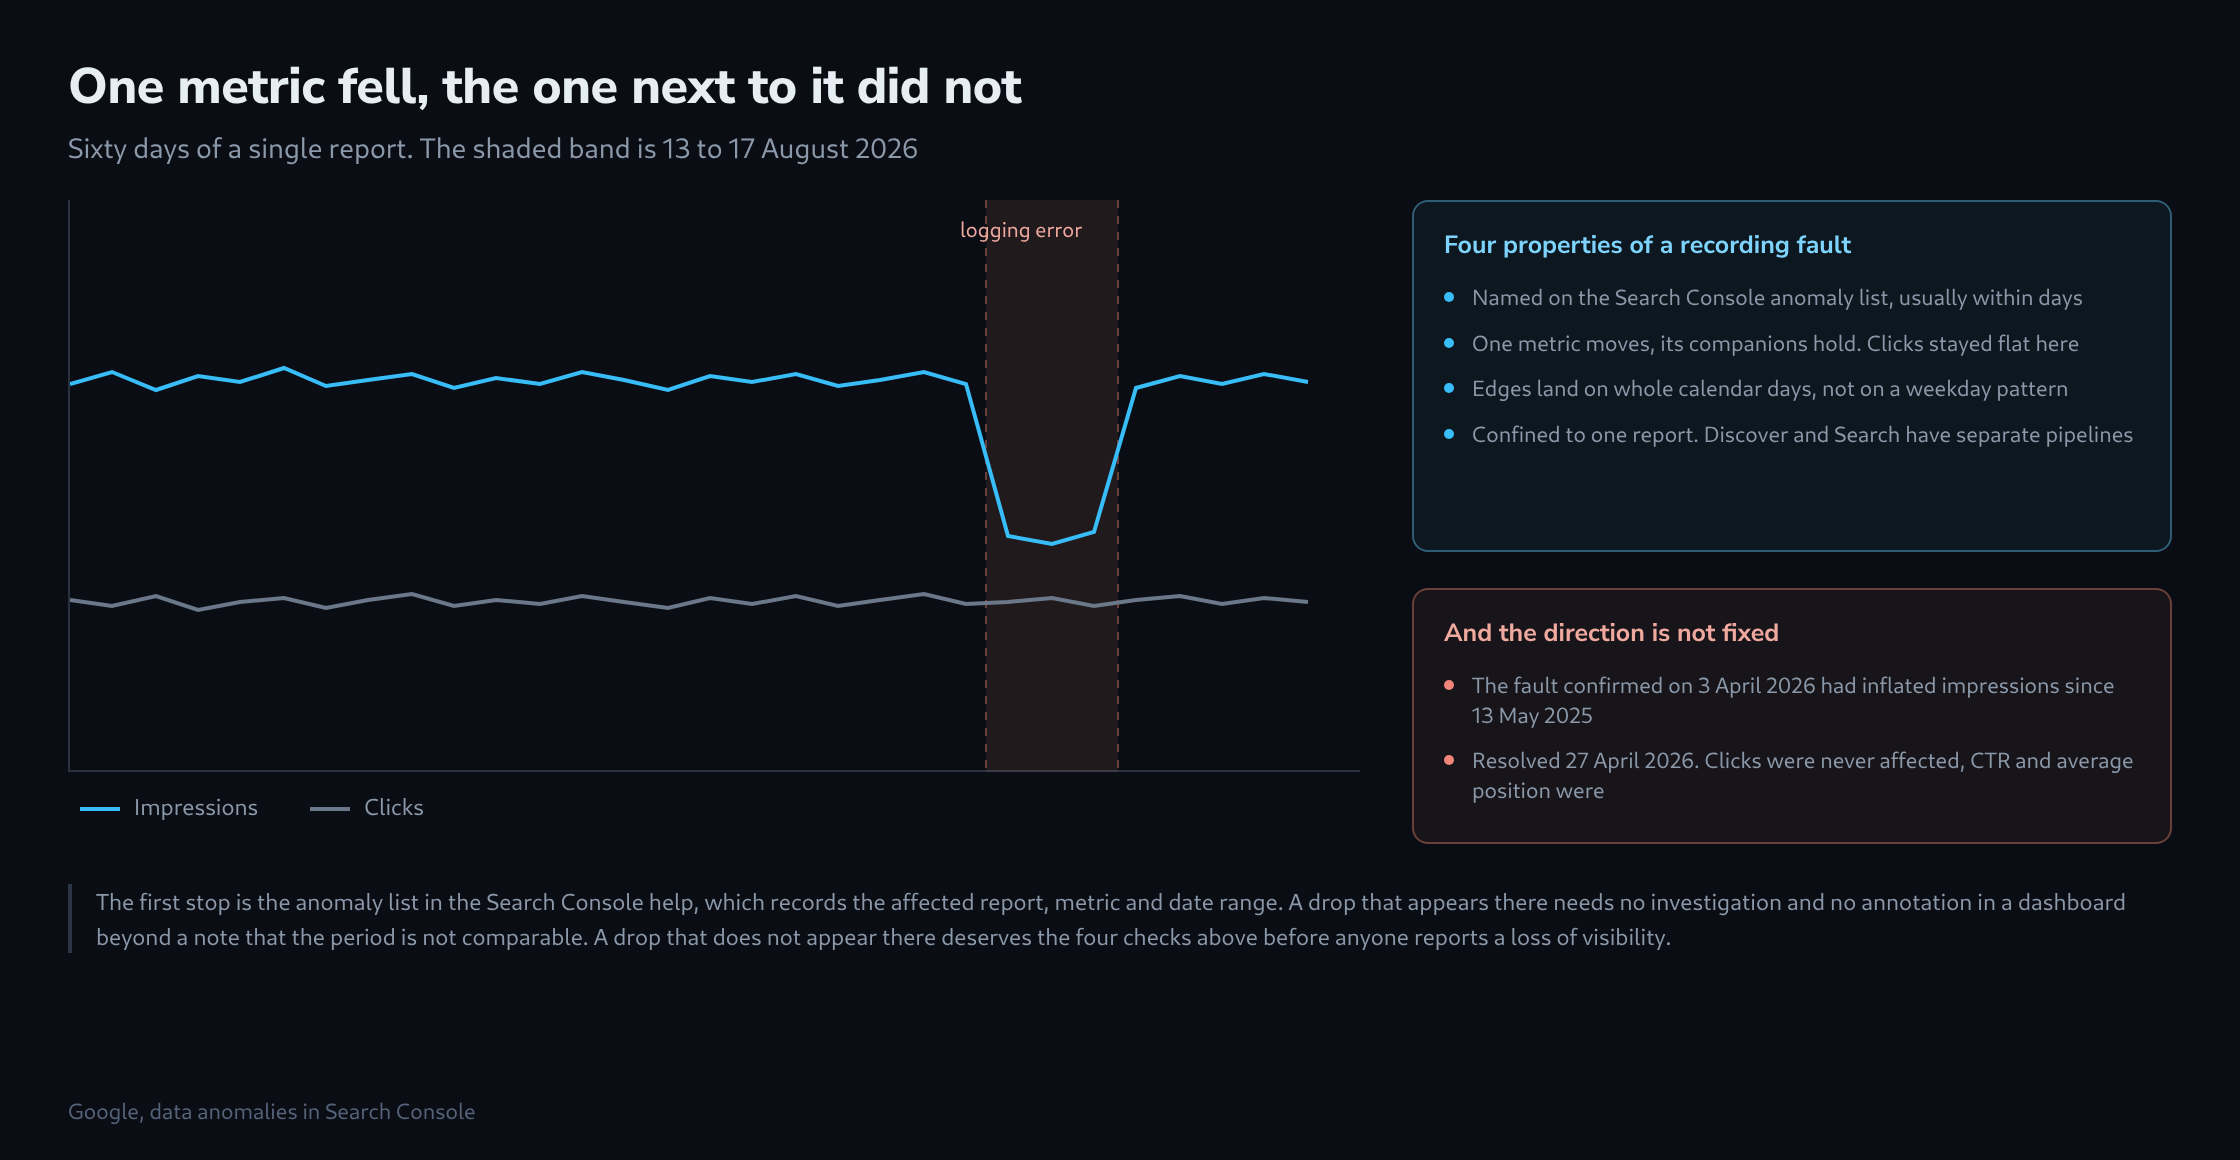
A report that loses half its impressions overnight looks like a catastrophe and is usually a bookkeeping fault. Google confirmed one such fault for 13 to 17 August 2026 in the Generative AI performance report, and a second, separate one for 13 August in Discover. Neither reflected anything happening in search results.
Telling the two apart matters because the responses are opposite. A real loss of visibility calls for work. A recording fault calls for an annotation and nothing else, and any work done in response to it will be credited to the wrong cause when the numbers return.
Start with the list
Google keeps a page of known data anomalies in the Search Console help, and it names the affected report, the affected metric and the date range. It is not a status dashboard and it is not fast, but entries appear within days and stay there permanently.
An anomaly that appears on that list is settled. Nothing needs investigating, and the only sensible action is to mark the period as not comparable wherever the numbers are read. The interesting case is the drop that is not on the list, either because it is genuine or because nobody has reported it yet.
Four properties that give a fault away
metrics       one moves, its companions hold
              impressions without clicks is the classic pair
              a real ranking loss moves both

edges         a fault starts and ends on a whole calendar day
              a visibility change follows traffic, so it bends
              across a week and shows the usual weekday shape

scope         one report, not all of them
              Discover, Search and the Generative AI report
              are logged separately and fail separately

corroboration server logs and analytics sessions come from a
              different pipeline entirely, so they either
              confirm the drop or isolate it to Search Console
The metric test is the strongest of the four and costs nothing. Impressions are counted when a result is rendered; clicks are counted when someone acts on it. A pipeline can lose one without losing the other, but the world cannot: a page that stops appearing also stops being clicked.
The corroboration test is the one people skip, and it is the only one that gives an independent answer. Sessions from organic search in an analytics property have no dependency on Search Console at all. If those held steady while impressions collapsed, the collapse was in the recording.
The direction is not always down
The case worth remembering from this year runs the other way. On 3 April 2026 Google confirmed that a logging error had been inflating impressions since 13 May 2025 – close to fifty weeks of numbers that were too high. The fix rolled out through the month and the issue was marked resolved on 27 April.
Clicks were never affected. Impressions were, and so was everything derived from them: click-through rate was understated for the whole period because its denominator was too large, and average position shifted because it is computed over impressions.
The awkward part is what happens at the moment of the fix. Impressions dropped when the correction landed, and that drop looked exactly like a loss of visibility to anyone who had not read the announcement. A year-on-year comparison drawn today still crosses that boundary, and the two sides of it are counted differently.
What to keep
Two habits cover most of this. The first is an annotation layer: every confirmed anomaly recorded with its date range, in the same place the charts live, so that a comparison spanning the boundary carries a visible warning rather than a silent one.
The second is a second source. One export of organic sessions per day from an analytics property, kept alongside the Search Console figures, turns a question that takes an afternoon into one that takes a glance. It does not have to be sophisticated. It only has to be independent.
Questions and answers
How can a year-on-year comparison across the April 2026 correction still be drawn?
Through clicks. They were never affected by the error and are counted the same way on both sides of the boundary. Impressions, click-through rate and average position from the period between 13 May 2025 and 27 April 2026, on the other hand, belong in no comparison with later figures, at least not without a note.
Organic sessions in analytics and clicks in Search Console differ widely. Is the corroboration test still worth anything?
Yes, as long as it compares the course of the two series rather than their level. The two figures count different things: Search Console counts clicks on search results, while an analytics property counts sessions that only come into being when the tag fires. Missing consent, an ad blocker or leaving before the page has loaded all produce a click without a session. Conversely, a session can count as organic without any click in Search Console behind it, for example when it comes from a search engine other than Google.
A constant gap therefore does no harm. What matters is whether both series bend on the same day. If impressions collapse while clicks and organic sessions carry on in their usual ratio, the fault lies in the recording.
One trap lies in the day boundaries. Search Console reports in Pacific Time, while a European analytics property usually runs on its own time zone. A fault that covers exactly one calendar day in Search Console spreads across two days in the comparison. That needs allowing for before a blurred edge is taken as the sign of a real drop.
Sources
Related articles