English
Tutorial: Building a Blended Google Ads + Meta Ads Performance Dashboard in Looker Studio

Contents
Google Ads and Meta Ads each report their own cost, conversions, and ROAS — inside their own interface, calculated their own way, with no shared view of what the two channels cost and delivered together. Looker Studio’s Data Blending feature closes that gap without a data warehouse: it joins two (or more) data sources on a shared dimension, such as date, into one blended table a dashboard can query directly.
The following walkthrough builds that dashboard: connecting Google Ads and Meta Ads as separate data sources, blending them on date, and turning the combined cost and conversion figures into a single blended ROAS and CPA for the whole paid budget.
Step 1: Connecting Both Ad Platforms
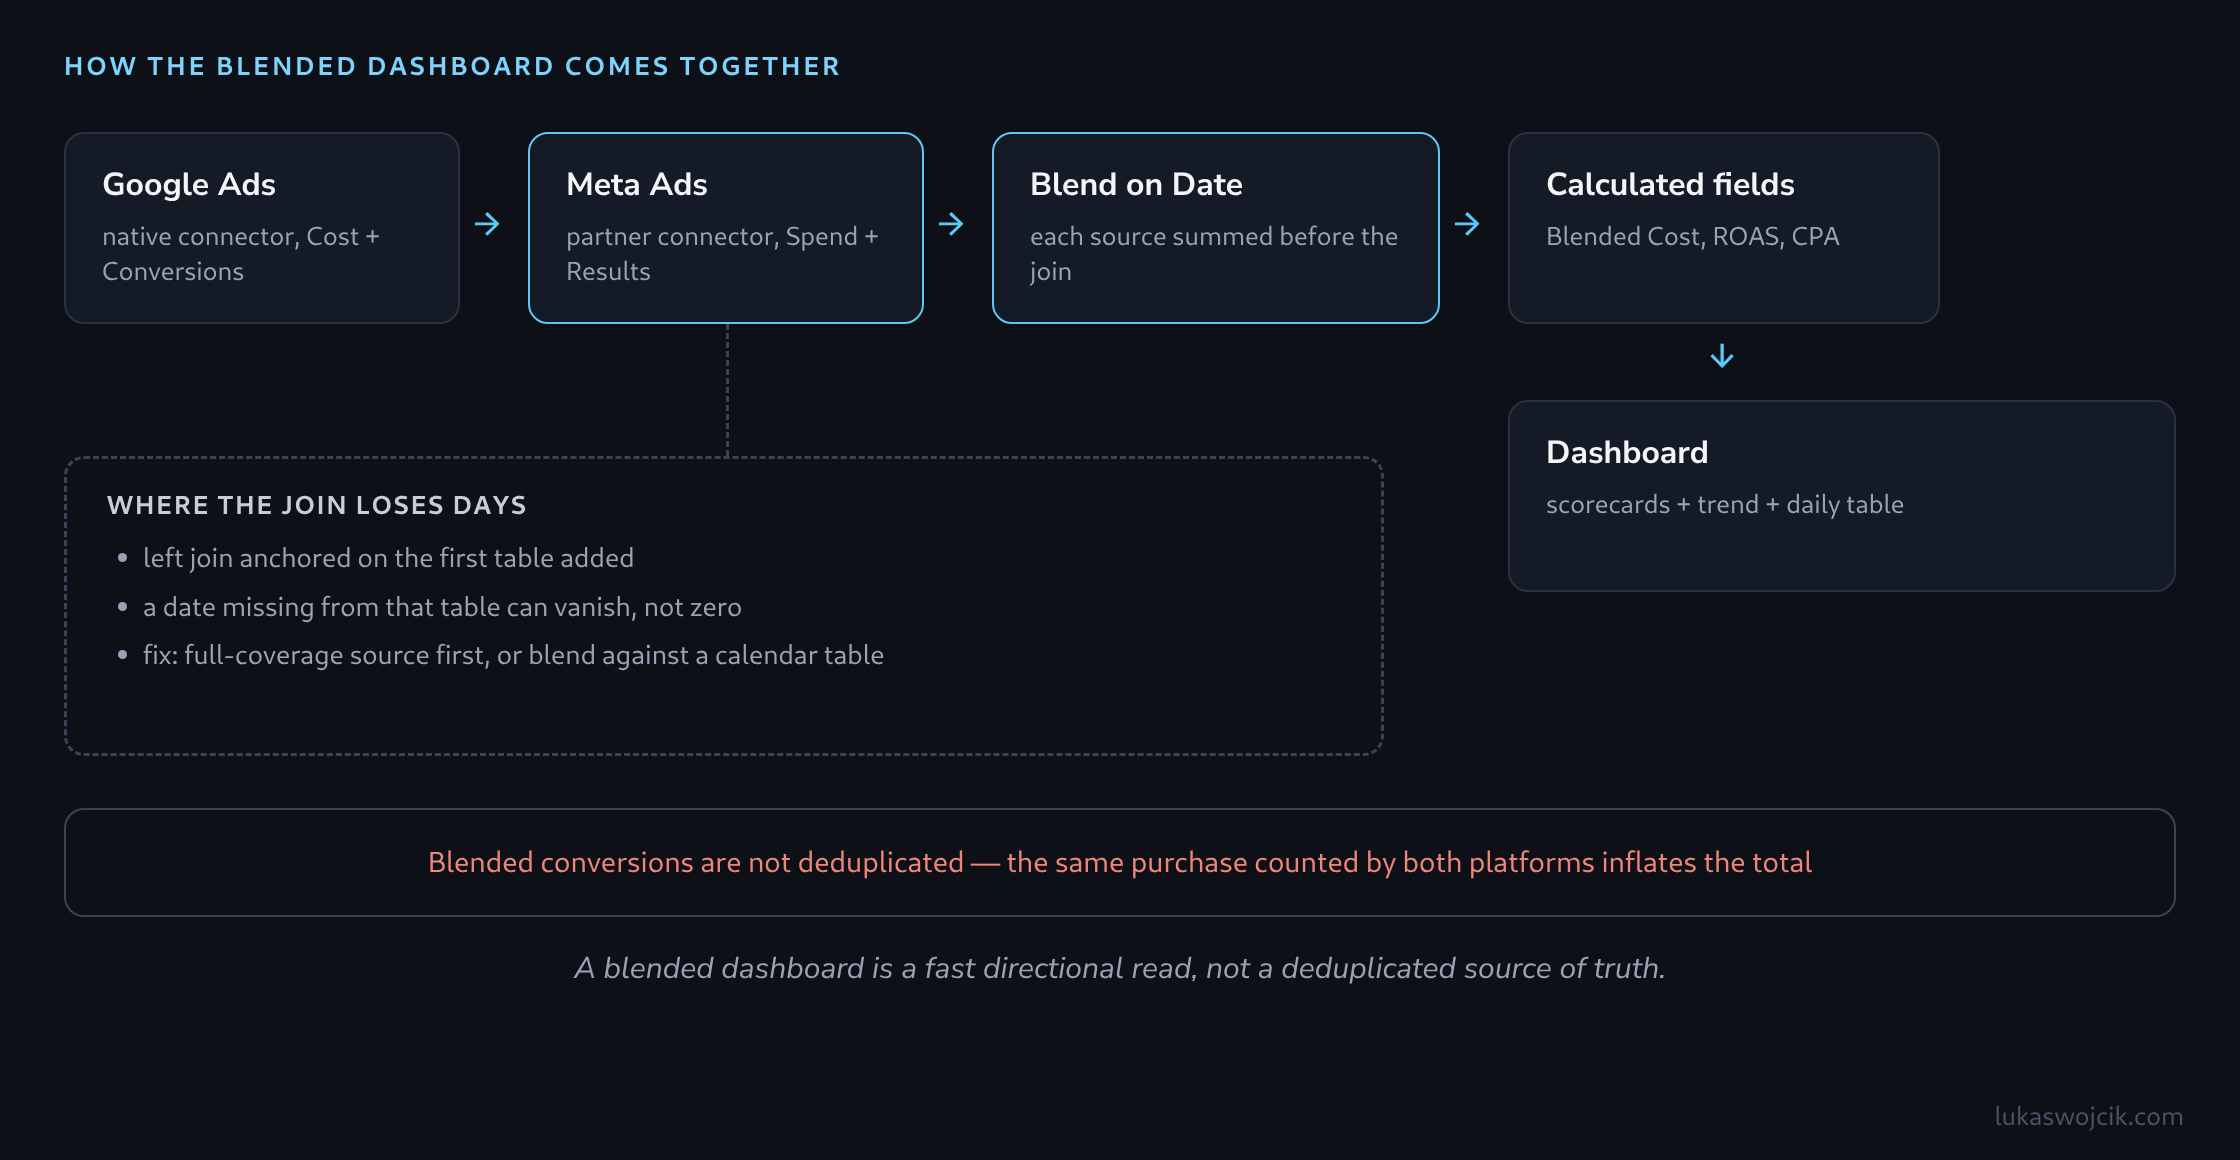
Google Ads has a native Looker Studio connector that exposes Cost, Conversions, Conversion Value, and Date directly. Meta does not ship a first-party Looker Studio connector; the practical path is a certified partner connector (or a scheduled export into a sheet or table Looker Studio can read) that surfaces the same shape of data from Meta Ads — Spend, Results, Conversion Value, and Date. Both data sources need to reach the dashboard as their own connections before anything gets combined.
Step 2: Building the Blend
Blend Data (under Resource, or from the toolbar depending on the Looker Studio version) creates a new table by joining data sources on one or more shared dimensions — Date is the natural join key here, since campaign names rarely match across platforms. Each source in the blend is aggregated on its own before the join runs, so Cost and Conversions should be added as SUM-aggregated metrics from each source rather than left at their default aggregation, which avoids inflating totals through row duplication on the join.
Step 3: The Join Gap That Loses Days
A blend behaves like a left join anchored on the first table added: dates present in the second source but missing from the first can disappear from the blended result instead of showing up as zero. This surfaces in practice as a paid dashboard whose weekly total quietly excludes a day where, say, Meta Ads had spend but Google Ads happened to have none. The reliable fix is picking whichever platform has guaranteed daily activity as the first table in the blend — or joining both against a small calendar table containing every date in the reporting range, so every day survives the join regardless of which platform spent on it.
Step 4: Calculating Blended ROAS and CPA
With Cost and Conversions available from both platforms inside the blended table, three calculated fields produce the whole-business view:
Blended Cost = SUM(Google Ads Cost) + SUM(Meta Ads Spend)
Blended Conversions = SUM(Google Ads Conversions) + SUM(Meta Ads Results)
Blended Conversion Value = SUM(Google Ads Conv. Value) + SUM(Meta Ads Conv. Value)

Blended ROAS = Blended Conversion Value / Blended Cost
Blended CPA = Blended Cost / Blended Conversions
Each platform’s own conversion value field needs to be normalized to the same currency before this addition means anything — a blend does not convert currencies on its own.
Step 5: Laying Out the Dashboard
Four scorecards — Blended Cost, Blended Conversions, Blended ROAS, Blended CPA — give the top-line business number at a glance. A time series chart plotting Google Ads cost, Meta Ads spend, and Blended Cost together shows how much of the trend is driven by which platform. Underneath it, a table broken down by date keeps the daily detail available. Nobody has to leave the dashboard to look up either platform’s own interface.
Staying Inside the Guardrails
A blended total is a reporting convenience, not a cleaned-up measurement. When someone sees both a Google and a Meta ad before buying, both platforms count that same purchase as their own conversion. This is a common outcome. The blended figure adds the two together and therefore counts the purchase twice, which makes blended CPA look better than it would after the double count is removed.
The right use for the blended dashboard is a fast read on total spend and a rough sense of direction on combined ROAS. A cross-channel figure that will hold up needs a shared identifier instead: an order ID, or a single analytics platform both channels report into. A Looker Studio blend on date alone will not do it.
Questions and answers
Why should blended ROAS not be calculated as the average of the two platforms’ ROAS?
Because averaging ratios weights each platform equally, regardless of how much budget it consumed. Assumed figures make this clear: Google Ads with €1,000 in cost and €4,000 in conversion value reaches a ROAS of 4, Meta Ads with €3,000 in cost and €6,000 in conversion value a ROAS of 2. The average would be 3. But €4,000 was spent and €10,000 taken in, so blended ROAS is 2.5.
The same trap exists in Looker Studio at row level. If ROAS is calculated per day and then aggregated in a chart with Average, the result is a mean of daily values in which a day with little spend counts as much as the biggest one. The formulas in Step 4 avoid this because they sum first and divide afterwards; defined that way, the field stays correct for any date range selected. The same applies to blended CPA.
What happens when the Google Ads and Meta Ads accounts use different time zones?
Then the same date does not cover the same hours in both sources, because each platform builds its days in its account’s time zone. The join on date lays shifted days on top of each other: monthly totals come out almost right, daily values and the edges of the reporting range do not. A note on the dashboard should record the difference so that day-by-day comparisons are not read as exact.
Sources
Related articles