English
 Deutsch
 Polski
GA4 Thresholding: How It Differs From Sampling and How to Get the Rows Back

Contents
A missing row in a GA4 report can have several causes. A privacy threshold, a sampled calculation, an (other) row and a truncated date range describe different limitations. The useful question is which mechanism applies to the specific response, before changing collection or campaign settings.
The diagram below is a simplified illustration of withheld rows. Its fifty combinations and fourteen visible rows are fictional; they are not Google’s published threshold or a measurement from a customer property.
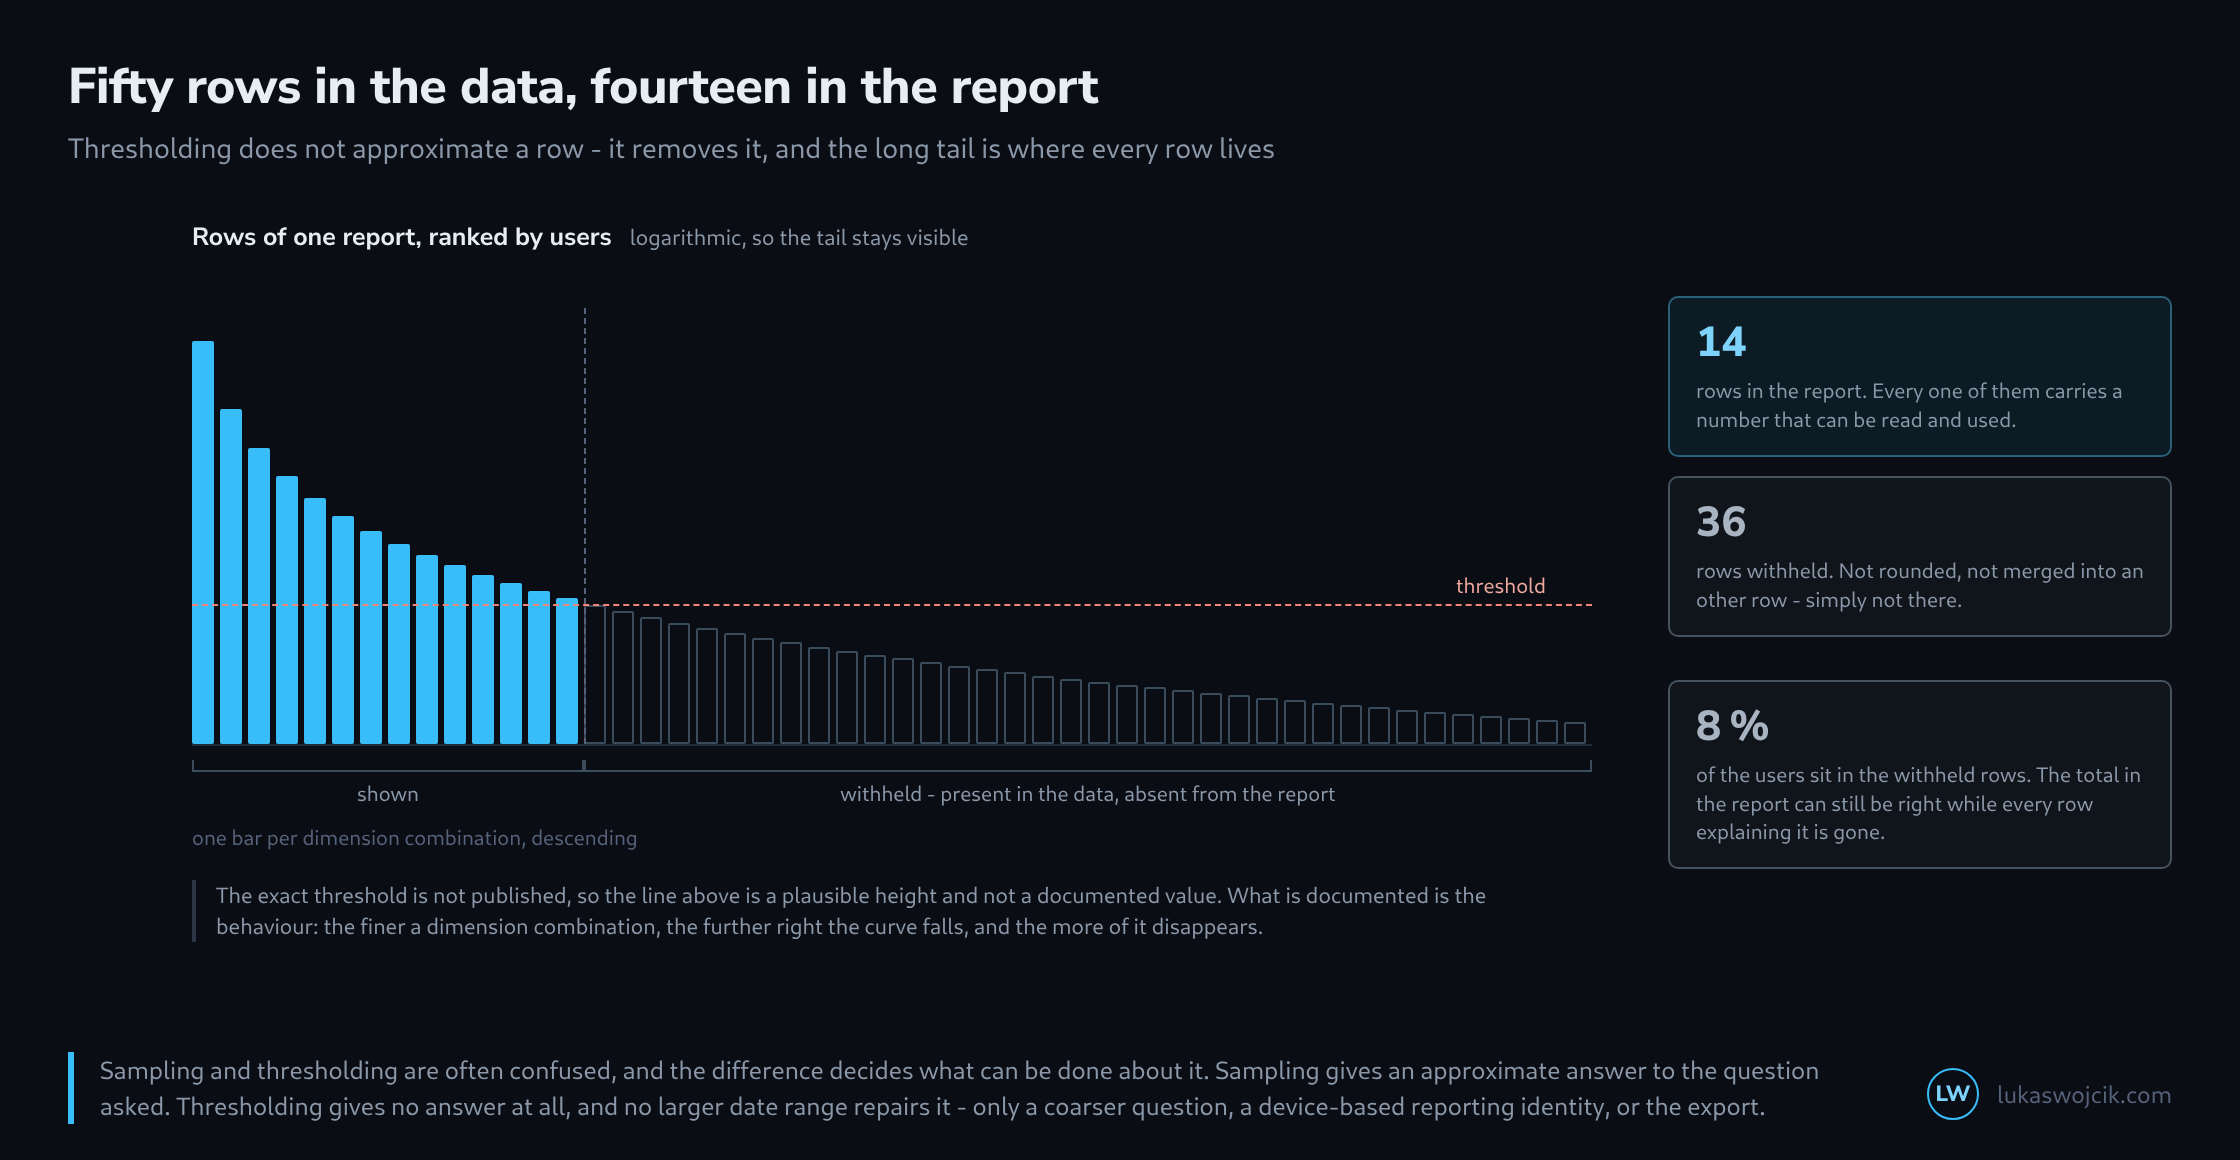
What privacy thresholds protect
Google applies system-defined thresholds to reduce the risk of identifying people or sensitive information. The documented cases include demographic data, audiences defined through demographics and search-query information. A small report is not automatically thresholded, and a detailed breakdown alone does not establish the cause of a missing row. The report’s quality indicator and response metadata provide a better starting point. [1]
Four mechanisms, four different questions
- Thresholding: does the report involve minimum aggregation thresholds?
- Sampling: was the calculation based on a subset of events?
- Cardinality: were dimension combinations combined into
(other)? - Truncation: was part of the requested data unavailable, for example for a particular period?
These conditions can coexist. A larger date range may help one question while changing the scope of another. A single badge labelled “data missing” would conceal the difference.
The September API addition: reasons for truncation
The Data API metadata now includes dataTruncationReasons. Each reason can carry a type, a message and affected dates. Those supplied dates are more useful than guessing which part of a long reporting period is available. The response also exposes sampling counts and active metric restrictions. [2]
{
  "metadata": {
    "subjectToThresholding": true,
    "dataTruncationReasons": [{
      "dataTruncationType": "DATA_TRUNCATION_TYPE_DATE_RANGE",
      "dataTruncationMessage": "Synthetic example"
    }]
  }
}
This deliberately minimal example demonstrates the structure, not an actual API result. Crucially, subjectToThresholding: true does not prove that rows were withheld: every row may satisfy the threshold. Likewise, dataLossFromOtherRow can be true even when a filter hides the (other) row. [2]
A repeatable investigation
A useful investigation retains the request, date range, dimensions, filters and response together. Next comes a check of the metadata. If the number of returned rows is smaller than rowCount, request pagination deserves attention; that difference is not itself proof of sampling. A second request should change one relevant element at a time so that its effect remains interpretable. [4]
For example, an analysis involving demographic information might compare a longer period or a report without the sensitive dimension. The comparison answers a changed question and needs that qualification. Switching reporting identity should not be presented as a universal threshold-removal technique.
BigQuery provides a different dataset
The export supports analysis of raw events, but it does not reproduce every enrichment in GA4 reports. Google Signals data is not exported, and the export has availability, configuration and processing limits. Streaming is a best-effort feed. Consequently, “every event with every field is always available” is too broad a promise. Differences between the interface and an SQL result require a comparison of definitions and available data. [1, 3]
Using the response inspector
The linked inspector separates metadata findings from API quota information. Quota consumption describes the request budget, not the completeness of the report. A missing quota object is not a zero balance, and missing metadata is not a clean bill of health. The tool interprets the supplied JSON locally; it cannot inspect a property or confirm correct event collection.
GA4 API Response Inspector · GA4 Thresholding and Behavioural Modelling Checker
Questions and answers
Why can a longer date range lift a threshold and create new problems at the same time?
A longer range gathers more users into each row, so more rows meet the minimum aggregation requirements. The same step changes three other things, however:
- Cardinality: over more days, more distinct values of a dimension come together, such as page paths or campaign names. That raises the likelihood of rare combinations being grouped into (other).
- Sampling: explorations, the freely configurable analyses in GA4, are based on a sample in a standard property once a query exceeds an event quota. A longer range contains more events and crosses that limit sooner.
- Truncation: if the range of such an analysis reaches back beyond the configured retention period for event data, the older days are missing from it.
Then there is the substantive side the article points out: a quarter instead of a week answers a different question. A comparison request that changes only the date range therefore shows in the metadata which mechanism has changed.
Does switching the reporting identity to “Device-based” help?
In some cases. Thresholds connected with Google Signals can often be avoided with the “Device-based” reporting identity, which relies on the device identifier alone; for the other documented cases this does not necessarily hold. In addition, users are counted differently afterwards, so the figure before and after the switch answers a different question.
Related articles