English
 Deutsch
 Polski
Time-Stretching: Tempo, Timing and Sound

Management Summary
Time-stretching makes a recording faster or slower while aiming to keep the notes at the same pitch. In music production, this helps recordings fit a different tempo without changing the melody. The choice of method matters: drum hits, sustained sounds and the balance between left and right can change in different ways. The comparison shows why no single setting suits every recording, and why accurate timing alone does not establish good sound.
Contents
Time-stretching changes the tempo of a recording while aiming to preserve its pitch. Two FFmpeg filters were measured with synthetic test signals: atempo and rubberband. Results depend strongly on the signal and settings. These measurements do not establish an overall winner for sound quality.
Tempo is not duration: A factor of 0.9 changes 120 BPM to 108 BPM and makes the recording 11.11 percent longer in theory. A factor of 1.1 produces 132 BPM and a recording 9.09 percent shorter. BPM means beats per minute. Paired values in the tables refer to 0.9 / 1.1.
What was measured
The archived series used FFmpeg 7.1.5, Rubber Band Library 3.3.0, 44.1 kHz and 32-bit float output. The results describe those versions and signals. No listening test was performed.
- Timing: 20 short clicks spaced 0.5 seconds apart. Output length, detected clicks and click offsets were checked.
- Hits: twelve single hits in total, alternating six kicks and six snares. Varying the spacing placed hits at different points in the processing. A level envelope smoothed over 3 ms describes the attack; onset is defined as its first crossing of 50 percent of that hit’s envelope peak.
- Tones: five-second sine tones at 110, 440 and 1760 Hz, and sawtooth tones at 55, 110, 220 and 440 Hz. Tempo factors 0.95 and 1.05 were tested in addition to 0.9 and 1.1. A sine contains one frequency; a sawtooth also contains many harmonics.
- Stereo: synthetic 16-second mixes containing drums, bass, pad and lead. Random components and starting phases vary between runs. The table therefore compares similar test mixes, not an identical input file throughout.
atempo joins overlapping pieces of audio at positions that match as closely as possible. This method is called WSOLA. At 44.1 kHz the inspected code uses 2048-sample windows, about 46.4 ms. rubberband uses the Rubber Band Library, including its handling of rapid sound attacks, also called transients.
Timing: separating offset from remaining error
The second numeric column is the median click offset: the middle of the sorted individual offsets. The last column measures something different: the largest remaining error among twelve hit positions after subtracting that click offset. A remaining error of 0.58 ms therefore does not mean that the unadjusted target time was reached within 0.58 ms.
| Method | Length error, 0.9 / 1.1 | Median click offset, 0.9 / 1.1 | Largest remaining hit error after offset correction, 0.9 / 1.1 |
|---|---|---|---|
atempo |
−26.6 / −20.7 ms | −15.2 / −19.9 ms | 10.84 / 8.35 ms |
rubberband, default (crisp) |
0.0 / 0.0 ms | −3.7 / +3.0 ms | 0.40 / 0.58 ms |
rubberband, transients=mixed |
0.0 / 0.0 ms | −3.7 / +3.0 ms | 1.50 / 2.04 ms |
rubberband, transients=smooth |
0.0 / 0.0 ms | −4.2 / +3.7 ms | 0.39 / 0.56 ms |
rubberband, window=long |
0.0 / 0.0 ms | −7.3 / +5.7 ms | 0.78 / 0.57 ms |
rubberband, channels=together |
0.0 / 0.0 ms | −3.6 / +3.0 ms | 0.37 / 0.52 ms |
The remaining hit errors were recalculated from the archived audio using the matching input for each run. The earlier analysis used one shared snare reference even though random snare components differed. This changes some timing values. Peak changes use a 0.25-ms smoothed envelope, not raw sample peaks; the onset and pre-onset levels use 3 ms.
Negative values mean shorter or earlier than the calculated target. All 20 clicks were detected. The rubberband output length was within one sample of the target; the table’s 0.0 ms is rounded. Nevertheless, the click medians were about 3.0 to 7.3 ms early or late, depending on the setting.
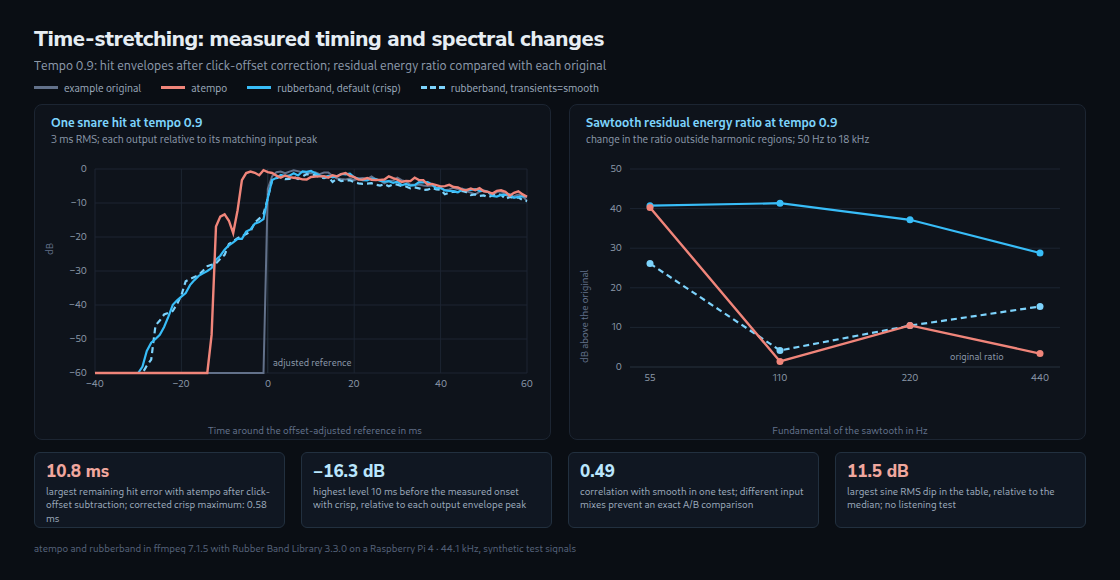
With atempo, the click sequence was about 21 to 27 ms too short. Its median was about 15 to 20 ms early. After subtracting that median, hit errors still reached 10.84 and 8.35 ms respectively. These are different quantities. The click median also does not prove that every part of a music file shifts by one fixed amount.
Hit attacks and peak levels
Peak changes are averages over six hits of each sound, not limits for every individual hit. The final columns show the highest level among twelve hits, measured 10 or 20 ms before each hit’s own 50-percent onset. Here, 0 dB refers to that hit’s own smoothed envelope peak.
| Method | Mean kick envelope peak change, 0.9 / 1.1 | Mean snare envelope peak change, 0.9 / 1.1 | Level 10 ms before onset, 0.9 / 1.1 | Level 20 ms before onset, 0.9 / 1.1 |
|---|---|---|---|---|
atempo |
−0.11 / −0.20 dB | −0.24 / −0.06 dB | −24.8 / −39.6 dB | analysis floor (−240 dB) |
rubberband, default (crisp) |
−1.43 / −0.67 dB | −1.99 / −1.75 dB | −22.8 / −16.3 dB | −35.9 / −29.3 dB |
rubberband, transients=mixed |
−0.90 / −1.64 dB | −0.54 / −1.82 dB | −14.5 / −12.3 dB | −25.6 / −20.6 dB |
rubberband, transients=smooth |
−0.73 / −1.28 dB | −0.88 / −1.60 dB | −20.3 / −14.9 dB | −33.1 / −30.4 dB |
rubberband, window=long |
−1.15 / −1.14 dB | −1.77 / −1.61 dB | −14.1 / −14.7 dB | −20.0 / −17.1 dB |
rubberband, channels=together |
−0.93 / −1.31 dB | −1.63 / −1.19 dB | −21.4 / −17.9 dB | −33.8 / −34.3 dB |
With rubberband, signal is already present before this defined onset. In particular, window=long reaches as high as −17.1 dB 20 ms earlier. This describes an attack spread over time. For atempo, the 20-ms value was at the analysis floor of −240 dB. The routine clamps very small values at that level; “absolutely no signal” would be a stronger claim.
The small average peak losses with atempo do not apply to every hit: one snare lost about 0.86 dB at tempo 0.9. The rubberband averages also hide larger individual losses. The chart shows one selected snare and does not replace the full series.
Sine tones: brief level drops
RMS describes the effective level of a short segment. Here, the smallest 10-ms RMS value is compared with the median of those values, excluding the first and last second. −11.5 dB means the quietest analysed segment was 11.5 dB below the typical level. A short RMS window can fluctuate slightly even on the original sine.
| Method | Sine 110 Hz, 0.9 / 1.1 | Sine 440 Hz, 0.9 / 1.1 | Sine 1760 Hz, 0.9 / 1.1 |
|---|---|---|---|
atempo |
−0.4 / −0.4 dB | −0.1 / −0.1 dB | 0.0 / 0.0 dB |
rubberband, default (crisp) |
−1.7 / −2.0 dB | −4.4 / −7.4 dB | −7.6 / −11.5 dB |
rubberband, transients=mixed |
−1.7 / −2.0 dB | −0.1 / −0.2 dB | −7.6 / −11.5 dB |
rubberband, transients=smooth |
−0.3 / −0.3 dB | −0.1 / −0.1 dB | −0.1 / −2.7 dB |
The default crisp setting shows substantial dips at several frequencies. smooth usually reduces these, but not completely: at 1760 Hz and tempo 1.1, the dip is still −2.7 dB. mixed helps at 440 Hz in this table, but not at all three frequencies.
The manufacturer documents different rules for resetting phases. This measurement series does not record those internal events. It therefore cannot establish the exact cause of each dip. A listening test assessing audibility is also missing.
Sawtooth tones: energy outside harmonic regions
Harmonics occur at multiples of the fundamental frequency. The analysis takes a two-second segment and applies a Blackman window, which lowers its edges for frequency analysis. Between 50 Hz and 18 kHz, narrow regions around estimated harmonics are excluded. The remaining energy is divided by the total energy within that frequency band. This gives a residual energy ratio, not a direct sound-quality rating.
The first table row gives that ratio for the original in dB. The other rows show its change relative to the original. For example, −50.1 dB plus 40.3 dB is about −9.8 dB. This means neither a tone 40.3 dB louder nor a general increase of “40.3 dB in audible distortion”.
| Method, tempo 0.9 | 55 Hz | 110 Hz | 220 Hz | 440 Hz |
|---|---|---|---|---|
| Original residual energy ratio | −50.1 dB | −47.1 dB | −43.9 dB | −41.0 dB |
atempo |
+40.3 dB | +1.4 dB | +10.5 dB | +3.4 dB |
rubberband, default (crisp) |
+40.7 dB | +41.4 dB | +37.2 dB | +28.8 dB |
rubberband, transients=mixed |
+40.8 dB | +41.0 dB | +24.8 dB | +23.3 dB |
rubberband, transients=smooth |
+26.1 dB | +4.2 dB | +10.5 dB | +15.3 dB |
atempo stands out at 55 Hz and tempo 0.9. At 110 Hz its value is much closer to the original. smooth does not win every column either. The analysis depends on window length, estimated fundamental and excluded regions. Broadened or shifted spectral lines can increase the residual ratio. A specific internal cause was not measured.
Stereo channels, level and processing time
Correlation here describes how similar the left and right waveforms are. A value of +1 means matching waveforms, possibly at different levels. −1 means opposite waveforms; parts can cancel when mixed together. Before processing, the value ranged from about 0.918 to 0.921 across test mixes. A similar value afterwards alone proves neither an unchanged stereo image nor good sound in mono.
| Method | Channel similarity afterwards, 0.9 / 1.1 | RMS change, 0.9 / 1.1 | Input duration / runtime, 0.9 / 1.1 |
|---|---|---|---|
atempo |
0.922 / 0.919 | −0.03 / −0.05 dB | 26.0 / 18.9 times |
rubberband, default (crisp) |
0.894 / 0.903 | −0.55 / −0.65 dB | 6.5 / 6.9 times |
rubberband, transients=mixed |
0.749 / 0.757 | −1.10 / −1.34 dB | 5.6 / 7.1 times |
rubberband, transients=smooth |
0.531 / 0.495 | −2.61 / −2.95 dB | 5.0 / 5.5 times |
rubberband, window=long |
0.906 / 0.909 | −0.44 / −0.71 dB | 3.7 / 6.2 times |
rubberband, channels=together |
0.920 / 0.919 | −0.55 / −0.65 dB | 5.1 / 4.7 times |
rubberband, smooth and together |
0.911 / 0.912 | −2.66 / −3.03 dB | 5.0 / 7.4 times |
rubberband, mixed and together |
0.940 / 0.935 | −1.12 / −1.35 dB | 5.5 / 8.1 times |
channels=together keeps the channels more closely linked. Values exceeded 0.91 with the tested combinations. This makes the option a useful candidate for comparing stereo material, not a general quality guarantee. The stereo correlation and mid/side meter supports technical checks. A comparison in stereo and mono is still needed.
The level column shows the RMS change, not loudness measured in LUFS. For example, −3 dB RMS does not automatically make a blanket 3 dB gain increase safe: peaks may become too high. Peaks and loudness need another check after any level adjustment.
The speed figure is the 16-second input duration divided by the shortest of three process runtimes on a Raspberry Pi 4. File operations and changing computer load contribute. The figures describe these trials, not guaranteed performance for arbitrary files or a project running many effects at once.
Practical conclusions
For rhythmic material, rubberband with channels=together and atempo are worth comparing. Actual hit positions and attack shapes both matter. For sustained tones, transients=smooth is another candidate. The measurements do not establish a recommendation for vocals: voices, acoustic recordings and reverb were not tested.
The BPM and delay time calculator helps with note lengths and delay times at the new tempo. The processing choice still needs checking with the actual audio.
Questions and answers
Will separately processed tracks stay synchronised?
The same tempo factor and options do not guarantee this. Processing responds to each track’s content. Differences between two settings’ click offsets therefore do not establish a fixed difference for arbitrary drum and pad tracks. A starting click checks only the start, not the whole recording.
Related microphone tracks need processing that preserves their timing relationship together, such as a dedicated grouped function in the audio application. Common events at the start, middle and end, and the combined result in mono, then need checking.
Does window=long reduce the signal before the hit?
Not in this measurement: its largest value 20 ms before onset was −17.1 dB. The corresponding maxima for crisp, smooth and channels=together were lower. This result applies to the tested hits and settings.
Does this comparison cover the R3 engine?
No. The inspected FFmpeg 7.1 code starts Rubber Band in real-time mode and has no dedicated engine selection; without an R3 flag, R2 is used. Other integrations or later FFmpeg versions need separate checks. The measured offsets are not universal library latency values.
Sources
Related articles