English
 Deutsch
 Polski
Automated Data Quality Alerts for GA4 with Looker Studio & BigQuery

Management Summary
Automatic data-quality alerts help spot unusual changes in website statistics before they distort business decisions. Comparing Google Analytics figures with the same weekdays in earlier weeks can reveal a sudden drop even while the website still works. BigQuery performs the analysis and Looker Studio presents the results. An alert signals a change to explain, not necessarily a broken measurement: campaigns, consent choices and missing data can also change the numbers.
Contents
A tracking failure can remain unnoticed while the website still works. A daily volume check provides a clue: how many events were exported, and how far does the count differ from a comparable weekday? BigQuery calculates the comparison; Looker Studio displays it. Notifications require a separately configured alert rule.
The example checks four event names. It does not validate every parameter or the entire measurement pipeline. Campaigns, holidays and consent changes can also explain a flagged result.
1. Data availability before event volume
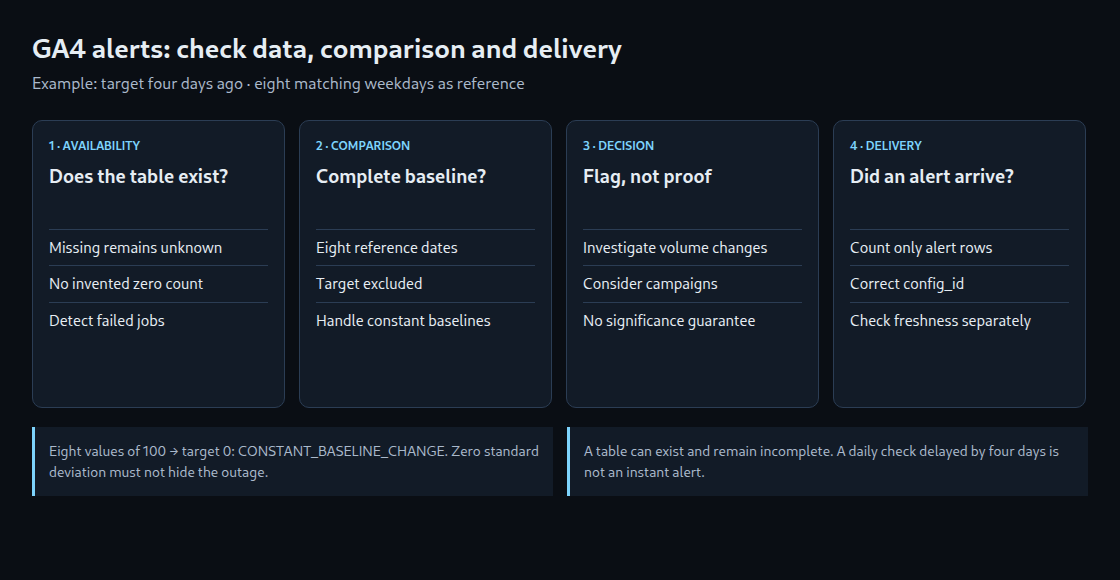
The target is four days ago, compared with the same weekday in the previous eight weeks. The target is excluded from the reference mean. This delay allows time for late exports but does not certify completeness. GA4 has no universally guaranteed daily export time; 05:30 UTC is not a safe completion boundary.
A missing daily table remains an unknown value. An absent event becomes zero only when its daily table exists. An existing table can still be incomplete. Here, session_start counts that event; it does not recreate the GA4 sessions metric.
2. SQL example with separate failure states
The project, dataset and every occurrence of the reporting timezone need replacement with the intended settings. The query expects GA4 daily tables with compatible schemas. If all matching tables or access permissions are missing, the job fails; separate operational monitoring must cover that case. A BigQuery trial run and cost estimate are required before scheduling.
-- GoogleSQL; replace project, dataset and reporting timezone.
WITH dates AS (
  SELECT d AS metric_date,
    DATE_SUB(CURRENT_DATE('Europe/Warsaw'), INTERVAL 4 DAY) AS target_date
  FROM UNNEST(GENERATE_DATE_ARRAY(
    DATE_SUB(CURRENT_DATE('Europe/Warsaw'), INTERVAL 60 DAY),
    DATE_SUB(CURRENT_DATE('Europe/Warsaw'), INTERVAL 4 DAY),
    INTERVAL 7 DAY)) AS d
),
available AS (
  SELECT table_name
  FROM `project_id.analytics_XXXXXXXXX.INFORMATION_SCHEMA.TABLES`
  WHERE table_type = 'BASE TABLE'
),
counts AS (
  SELECT PARSE_DATE('%Y%m%d', event_date) AS metric_date,
    event_name, COUNT(*) AS event_count
  FROM `project_id.analytics_XXXXXXXXX.events_*`
  WHERE _TABLE_SUFFIX BETWEEN
    FORMAT_DATE('%Y%m%d', DATE_SUB(CURRENT_DATE('Europe/Warsaw'), INTERVAL 60 DAY))
    AND FORMAT_DATE('%Y%m%d', DATE_SUB(CURRENT_DATE('Europe/Warsaw'), INTERVAL 4 DAY))
    AND event_name IN ('purchase', 'add_to_cart', 'begin_checkout', 'session_start')
  GROUP BY 1, 2
),
grid AS (
  SELECT d.metric_date, d.target_date, n AS event_name,
    IF(a.table_name IS NULL, NULL, COALESCE(c.event_count, 0)) AS event_count
  FROM dates AS d
  CROSS JOIN UNNEST(['purchase', 'add_to_cart', 'begin_checkout', 'session_start']) AS n
  LEFT JOIN available AS a
    ON a.table_name = CONCAT('events_', FORMAT_DATE('%Y%m%d', d.metric_date))
  LEFT JOIN counts AS c ON c.metric_date = d.metric_date AND c.event_name = n
),
stats AS (
  SELECT target_date AS metric_date, event_name,
    MAX(IF(metric_date = target_date, event_count, NULL)) AS event_count,
    COUNT(IF(metric_date < target_date, event_count, NULL)) AS reference_days,
    AVG(IF(metric_date < target_date, event_count, NULL)) AS expected_avg,
    STDDEV_SAMP(IF(metric_date < target_date, event_count, NULL)) AS reference_sd
  FROM grid
  GROUP BY target_date, event_name
),
scored AS (
  SELECT *,
    IF(reference_days = 8,
      SAFE_DIVIDE(event_count - expected_avg, reference_sd), NULL) AS z_score
  FROM stats
),
classified AS (
  SELECT *,
    CASE
      WHEN event_count IS NULL THEN 'MISSING_EXPORT'
      WHEN reference_days != 8 THEN 'INCOMPLETE_BASELINE'
      WHEN reference_sd = 0 AND event_count != expected_avg THEN 'CONSTANT_BASELINE_CHANGE'
      WHEN reference_sd = 0 THEN 'NO_CHANGE'
      WHEN z_score < -2.0 THEN 'DROP'
      WHEN z_score > 3.0 THEN 'SPIKE'
      ELSE 'WITHIN_RULE'
    END AS quality_status
  FROM scored
)
SELECT *, CURRENT_TIMESTAMP() AS evaluated_at,
  IF(quality_status IN ('NO_CHANGE', 'WITHIN_RULE'), 0, 1) AS alert_flag
FROM classified
ORDER BY event_name;
reference_days must equal eight. A missing reference produces INCOMPLETE_BASELINE; a missing target produces MISSING_EXPORT. A constant baseline cannot support division by its standard deviation: eight values of 100 followed by zero therefore produce CONSTANT_BASELINE_CHANGE. Eight values of 100 followed by 100 produce NO_CHANGE.
With a varying baseline, the z-score describes distance from the mean relative to the variation in the eight reference values. For example, a mean of 100, a sample standard deviation of 10 and a new value of 70 give (70 − 100) / 10 = −3. The standard deviation measures how spread out the reference values are. The −2 and +3 thresholds are investigation rules, not calibrated significance tests. Eight observations provide limited evidence; multiple checks and low event volumes can produce misleading flags. WITHIN_RULE only means that this rule did not trigger.
3. Result storage and alert delivery
- A monitoring dataset is created in a suitable BigQuery region. The account running the query needs checked read and write permissions.
- A manual first run is expected to return four rows including
evaluated_atandalert_flag. The cost estimate needs review: the table range spans 57 days even though only nine comparison dates are needed. - Scheduling follows observed export availability. The current-result destination table can be replaced after each successful run. A separate history requires run identifiers and a retry-deduplication rule; blind appends create duplicates.
- Looker Studio displays target date, event, count, reference mean, status and evaluation time. Pro chart alerts support email notifications and use default filters. Sending a report to Google Chat is a different feature from a conditional data alert.
- Cloud Monitoring uses a separate query returning only alert rows. The automatic
bigquerydatatransfer.googleapis.com/transfer_config/last_execution_job_rowsmetric counts result rows, not z-scores. The rule filters to the correctconfig_idand alerts above zero.
The alert query must follow a successful calculation and check freshness, the expected target date and all four result rows. An old healthy table must not conceal a failed new run. Job failures and missing runs need separate monitoring: the last row-count value can persist after a failure. Notification channels need verification with controlled cases before delivery can be relied on.
4. Acceptance checks before daily operation
- Constant baseline followed by total loss: a change is flagged, not a false normal result.
- Missing daily table: missing export, not an invented event zero.
- Missing reference week: comparison withheld.
- Unchanged constant baseline: no change.
- Failed job or stale results: operational warning independent of the data-quality status.
The status decision was checked in isolation with synthetic cases. This does not demonstrate a working BigQuery, Pro or Cloud Monitoring installation. Daily checks with a four-day delay explicitly cannot deliver instant outage alerts. Faster detection needs a separate assessment of provisional data.
Questions and answers
Why is filling missing counts with zero insufficient?
Without a date grid, days without events disappear. Filling every gap with zero, however, confuses a missing export with an observed zero day. The example also checks whether the table exists.
Does a flag prove a tracking failure?
No. Investigation needs additional evidence: releases, CMP changes, campaigns, server errors and export state. A volume rule cannot identify the cause or validate individual parameter values.
Practical check: a weekday baseline without the inspected day
The GA4 Anomaly Detector now compares a selected reporting day with the same weekday from each of the eight previous weeks. A Thursday is compared with eight Thursdays. The inspected day is excluded from the reference mean and sample standard deviation, so a sharp drop cannot pull its own baseline down.
The tool reads sessions, total users, page/screen views, key events, event count, total revenue and engagement rate through the read-only Data API. The default date is four days ago to leave time for processing, but that delay does not certify that the report is complete. The property’s reporting timezone and the returned metadata remain relevant.
- The selected day must have ended; the eight reference dates shown in the result need checking.
- If a required date is absent from the response, the comparison is withheld. Missing rows are not silently replaced with zeros; a reported zero remains zero.
- The descriptive z-score is compared with the chosen threshold. With a constant baseline, the tool reports either no change or a change from that constant value, without dividing by zero.
- The nine comparison dates can be downloaded as CSV. Any flagged change is compared with releases, campaigns, holidays and other evidence.
Eight observations are a small reference set. These flags are not calibrated significance tests, and seven concurrent metric checks can generate chance findings. Weekday matching does not remove trends, special events, consent changes or processing delays. No flag proves complete tracking, and a flag does not establish the cause. This is a manual investigation tool, not a scheduled alert service.
Sources: Google runReport reference, metric definitions and NIST guidance on outlier detection and its assumptions.
Sources
Related articles