English
 Deutsch
 Polski
Denoising With afftdn and anlmdn: Controls, Signal Changes and Measurement Limits

Management Summary
Denoising reduces unwanted background noise in music and voice recordings. The two filters compared here try to distinguish noise from useful sound in different ways. Stronger processing can also alter instruments, voices and fading notes, so a quieter pause does not by itself mean a better recording. The examples show why settings need to match the actual noise and material. The aim is less distraction while preserving the sound that matters, with listening as well as measurements guiding the balance.
Contents
FFmpeg includes the denoisers afftdn and anlmdn. afftdn splits short sections of audio into frequency components and attenuates components that fit an assumed noise profile. This test focuses on two controls: nr limits noise reduction in dB, while nf sets the assumed noise floor. Their defaults are 12 and −50. anlmdn compares similar short signal sections; this test mainly varies its strength s. Both filters have additional controls.
The experiment compares filtered audio with a known clean original. A separate test shows how much each filter also changes that clean material. This does not precisely separate the causes of the difference in the noisy output: a denoiser can respond differently to clean and noisy inputs. The measurement describes waveform deviation: how much the filtered signal differs from the original after both are aligned in time. It is not a listening-test verdict.
How this was measured
- Material: 32 s of synthetic music containing kick, snare, hi-hats, bass, pad and lead, averaged to mono and normalised to a peak of 0.5 (half digital full scale). Another 0.3 s of silence follows. Its RMS level is −19.62 dBFS; white noise is added at a known level. RMS, or root mean square, measures average signal strength. 0 dBFS refers to digital full scale; negative values lie below it.
- Metric:
20 × log10(RMS(output − original) / RMS(original)). The waveforms are time-aligned and subtracted. Noise 40 dB below the original produces a deviation of −40 dB before processing: the positive signal-to-noise ratio is 40 dB. A negative change in deviation means the result is closer to the original by this measure. It does not directly establish audibility or sound quality. - Test without added noise: the filter also processes the clean signal. The difference measures changes caused by processing, not necessarily missing music or audible damage. It cannot simply be subtracted from the deviation in the noisy test.
- Alignment: at 44.1 kHz, afftdn’s output was delayed by 1102 samples or 24.99 ms in this setup; anlmdn’s by 353 samples or 8.00 ms. Cross-correlation finds the time offset with the closest match. Only the shared length is then compared, excluding a short section at the end.
- Counter-check: afftdn outputs the removed component with
output_mode=noise; anlmdn usesoutput=n. Its RMS level and that of the calculated difference agree to two decimal places here. This supports the difference measurement, without establishing that the processing is inaudible.
Changes to the clean signal
| Setting | Deviation on clean signal | Change in level |
|---|---|---|
afftdn, nr 6, nf −50 |
−43.29 dB | −0.00 dB |
afftdn, default nr 12, nf −50 |
−42.19 dB | −0.00 dB |
afftdn, nr 24, nf −50 |
−41.67 dB | −0.00 dB |
afftdn, nr 48, nf −40 |
−26.16 dB | −0.05 dB |
anlmdn, s 0.001 |
−151.94 dB | 0.00 dB |
anlmdn, s 0.01 |
−105.77 dB | −0.00 dB |
anlmdn, s 0.1 |
−67.83 dB | −0.00 dB |
The overall level barely changes although the waveform does. With afftdn at nr 12 and nf −50, the deviation is 42.19 dB below the signal; with nr 48 and nf −40, it is only 26.16 dB below. Two controls changed in the latter case, so the difference cannot be attributed to either control alone. anlmdn changes this material very little at s 0.001 and 0.01. Audibility was not tested.
How nr and nf behave in this test
| Control changed | Value | Change in deviation | Deviation on clean signal |
|---|---|---|---|
| noise reduction, nf fixed at −50 | nr 3 | +0.38 dB | −45.28 dB |
| noise reduction, nf fixed at −50 | nr 12 | +1.16 dB | −42.19 dB |
| noise reduction, nf fixed at −50 | nr 48 | +1.50 dB | −41.49 dB |
| noise reduction, nf fixed at −50 | nr 90 | +1.50 dB | −41.48 dB |
| noise floor, nr fixed at 12 | nf −70 | +0.55 dB | −48.71 dB |
| noise floor, nr fixed at 12 | nf −55 | +0.32 dB | −47.72 dB |
| noise floor, nr fixed at 12 | nf −45 | +6.74 dB | −33.70 dB |
| noise floor, nr fixed at 12 | nf −40 | +13.25 dB | −26.80 dB |
| noise floor, nr fixed at 12 | nf −30 | +21.23 dB | −18.78 dB |
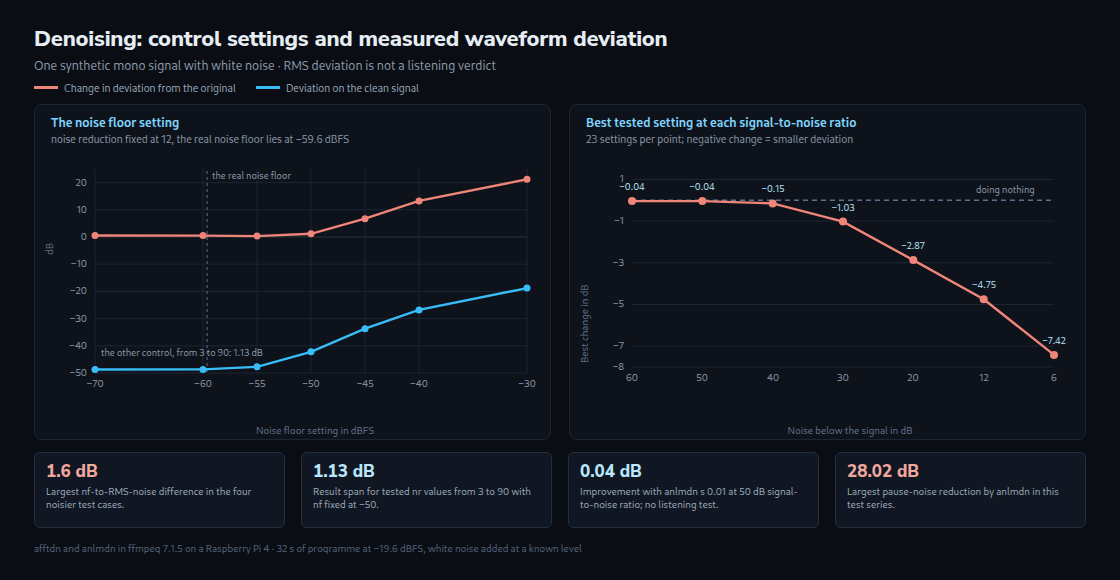
Both series use the same material with noise 40 dB below the signal, corresponding to an RMS noise level of −59.6 dBFS. A positive value in the third column means the distance to the clean original has grown.
With nf fixed at −50, the smallest and largest results across the tested nr values differ by about 1.13 dB. The result barely changes between nr 48 and nr 90. Varying the tested nf values with nr fixed at 12 produces a 20.91 dB span. Thus nf has the larger effect in this experiment; nr is neither ineffective nor generally unimportant.
From nf −45 to −30, the change in deviation rises by 14.49 dB and the deviation on clean material rises by 14.92 dB. These similar values indicate substantial processing of the wanted signal. They do not prove that all noise disappeared: residual noise and changes to the music both contribute to the output difference.
Results at seven signal-to-noise ratios
| Signal-to-noise ratio | RMS noise level | Best tested setting | Change in deviation |
|---|---|---|---|
| 60 dB | −79.6 dBFS | anlmdn, s 0.01 | −0.04 dB |
| 50 dB | −69.6 dBFS | anlmdn, s 0.01 | −0.04 dB |
| 40 dB | −59.6 dBFS | anlmdn, s 1.0 | −0.15 dB |
| 30 dB | −49.6 dBFS | afftdn, nr 12, nf −50 | −1.03 dB |
| 20 dB | −39.6 dBFS | afftdn, nr 48, nf −40 | −2.87 dB |
| 12 dB | −31.6 dBFS | afftdn, nr 12, nf −30 | −4.75 dB |
| 6 dB | −25.6 dBFS | afftdn, nr 48, nf −25 | −7.42 dB |
Each row tests 20 afftdn combinations of nr 12 or 48 with ten nf values, plus three anlmdn strengths. The table identifies the actual best combination in this limited grid. A smaller positive signal-to-noise ratio means more noise.
In the four noisier cases, the best tested afftdn nf lay between 0.4 dB below and 1.6 dB above the broadband RMS noise level. This is an observation on this signal. It establishes neither a universal setting accuracy nor that the −50 default only suits noise at exactly −50 dBFS.
At signal-to-noise ratios of 60 and 50 dB, anlmdn with s 0.01 improves the metric by about 0.04 dB; at 40 dB, s 1.0 achieves about 0.15 dB. At 30 dB, afftdn improves it by 1.03 dB; at 6 dB, by 7.42 dB. These results describe the grid and the waveform deviation. The point at which denoising becomes audibly beneficial remains untested.
Which frequencies and decays change
| Third-octave band | afftdn, default |
anlmdn, s 0.01 |
|---|---|---|
| 63 Hz | −127.02 dB | −155.92 dB |
| 250 Hz | −130.46 dB | −140.91 dB |
| 1 kHz | −85.79 dB | −114.97 dB |
| 2 kHz | −46.84 dB | −104.29 dB |
| 4 kHz | −32.70 dB | −95.24 dB |
| 8 kHz | −27.10 dB | −90.93 dB |
| 10 kHz | −23.26 dB | −87.18 dB |
| 16 kHz | −29.78 dB | −91.77 dB |
A third-octave band covers a limited frequency range; three such bands span an octave. The table compares the energy of the difference with that of the clean signal in the same band. The script uses a fast Fourier transform (FFT) to separate frequencies. It analyses overlapping sections of 32,768 samples. A Hann window attenuates their edges to reduce artificial frequency components at the boundaries. This is not a standard-certified third-octave filter bank. On this material, afftdn’s relative differences are larger in the treble than in the bass, especially at 10 kHz. This does not apply universally to all denoisers or recordings.
For a single hi-hat hit, each measurement covers a 20 ms section starting 50, 100, 200 or 400 ms after the peak. afftdn at its default reduces their levels by a rounded 0.00, 0.00, 0.00 and 0.35 dB. With nf −40 and nr 48, the section starting at 200 ms loses 0.27 dB, and the section at 400 ms loses 7.71 dB. This establishes stronger attenuation of the late decay in this example, not a universal threshold.
In the final pause, afftdn at its default reduces noise by 10.52 dB; nr 48 with nf −40 reduces it by 19.98 dB. anlmdn achieves 26.06 to 28.02 dB at the strengths tested here. A quieter pause demonstrates the effect on noise without music. Assessing quality during music also requires checking its decays and changes to the wanted signal.
What follows from this
A section without music or speech helps estimate noise level and frequency distribution. A broadband RMS reading is a starting point for nf, not a guaranteed optimum. The linked noise floor meter supports that estimate. afftdn also offers captured noise profiles, custom band values and automatic noise-floor tracking. Audacity uses a noise profile too; that does not make the algorithms or controls equivalent.
A cautious comparison varies nf and nr gradually. Music passages, decays and the removed-component output complement the comparison of pauses. Recognisable voice or instruments in the removed component indicate excessive processing. This experiment does not justify leaving nr unchanged in every case.
The tested settings made little improvement in the quietest noise cases. This is not a general argument against processing clean recordings or evidence that bit depth caused the noise. Recording noise and quantisation errors are different problems. The companion article on dither on export discusses reducing bit depth.
What this covers and what it does not
- The measurement used white noise. Hum, tape hiss and room tone are distributed differently;
afftdncarries its own presets for vinyl and shellac, which were not tested here. - Waveform deviation assesses neither audibility nor the type of error. Steady noise and short tonal artefacts can attract different levels of attention at the same RMS level. A better metric does not guarantee a more pleasant sound; a worse metric does not rule out a subjective benefit.
- The nf grid is −70, −60, −55, −50, −45, −40, −35, −30, −25 and −20. The first gap is 10 dB; the others are 5 dB. Other values and additional filter options were not optimised.
- Only the 60 dB signal-to-noise case has an actual noise level, −79.6 dBFS, below the smallest tested nf of −70. At 50 dB, the noise level is −69.6 dBFS and lies above it. FFmpeg 7.1.5 allows nf down to −80; that lower range is missing from the grid. A complete claim about the attainable optimum is therefore not possible.
Questions and answers
What does the 25 ms delay do when the denoised track goes back into the mix?
An uncompensated offset shifts the processed track relative to other tracks. Parallel copies or sound shared between microphones can also produce tonal changes. Even a vocal track can share sound with other microphones. The measured 24.99 and 8.00 ms apply to this setup, not universally to each filter.
Summing a signal with an equally loud, otherwise identical copy delayed by 25 ms creates regular cancellations: the first at 20 Hz, then every 40 Hz. This is comb filtering. A processed signal is not an identical copy, so the positions and depths of the dips can differ from this simple model.
Before parallel mixing, the actual alignment of the exported files needs checking. Any timing correction already applied must not be applied twice. Correcting by trimming the start also requires preserving the end, for example with sufficient extra material during rendering. The measurement script compares only the shared length; it is not a complete export procedure.
Can the right nf value be worked out from how far the noise lies below the signal?
With compatible RMS measurements, noise level equals signal level minus the positive signal-to-noise ratio: −19.62 dBFS minus 30 dB gives −49.62 dBFS. This provides a starting point. The best nf also depends on the spectrum, material and other settings. A noise-only passage helps the estimate but does not replace checking the result.
Sources
- FFmpeg 7.1.5 filter documentation: algorithms, additional controls, nf range −80 to −20, noise profiles, tracking and different output modes.
- Audacity: Noise Reduction: noise profiles, cautious settings and monitoring the removed component.
- Original measurement scripts: dn_messung.py, dn_regler.py and dn_grenze.py. The tables use RMS differences and FFT band energies, not loudness measurement under ITU-R BS.1770.
Related articles