English
 Deutsch
 Polski
Reverb Measured: How Decay Time, Pre-Delay, Reverb Level and a Send High-Pass Change Clarity

Management Summary
Reverb adds lingering sound to a recording, creating a sense of space but potentially covering vocals, drum attacks and pauses. This model explains how the amount of reverb, its duration and its start time affect the balance between the original sound and the lingering tail. Reducing the effect level or keeping deep bass out of the reverb offers ways to retain clarity without removing the effect entirely. The measurements explain these relationships; the best musical setting still depends on the recording.
Contents
Reverb can cover attacks and fill pauses with decaying sound. This experiment examines how decay time, delay, reverb energy and filtering change that distribution over time. The measurements describe artificial signals. The numbers do not replace a listening comparison or directly predict the intelligibility of a real vocal recording.
The original measurements were made on 23 September 2026 with ffmpeg 7.1.5 and numpy. The complete synthetic experiment was repeated in a separate test directory on 25 October 2026: all 367 stored numerical values matched the original exactly. This confirms the reproducibility of this setup, not its applicability to every reverb plugin.
How it was measured
An impulse response describes the reaction to a very short excitation. Here, the response starts with a direct impulse followed by decaying artificial noise. The specified time T describes a fall of 60 dB. The total energy of the tail is set relative to the direct impulse: −10 dB means one tenth of the energy. This is neither a conventional wet/dry percentage nor automatically a plugin send level. Pre-delay moves the start of the tail. In the damped version, high-frequency regions decay faster.
The ffmpeg afir filter applies the impulse response to the test signal. Automatic normalisation is disabled, so the chosen reverb energy is not rescaled afterwards. The analysis uses three quantities:
- T30: Tail energy is summed backwards. The fall between −5 and −35 dB is used to estimate a time for a 60 dB fall. T30 names the estimation procedure, not a duration of 30 seconds.
- C50 and C80: Ten times the base-10 logarithm of the early-to-late energy ratio, expressed in dB. Early means before 50 or 80 ms here. These are fixed calculation windows, not universal thresholds for good music.
- Modulation depth m: Noise regularly becomes louder and quieter. At 4 Hz, this means four fluctuations per second. A smaller output value means a less pronounced loud–quiet pattern after the reverb. The test uses noise from 200 Hz to 4 kHz and fluctuation rates from 0.5 to 16 Hz. The calculation compares the strength of the regular output-intensity fluctuation with its average intensity. The measured strength of the input fluctuation is not used as a correction factor. Because the noise sample has a finite duration, the estimate can slightly exceed the ideal range of 0 to 1.
Modulation depth can also be calculated for the simplified exponential model. The prediction and the 96 measured points in the decay, pre-delay and reverb-energy series differ by 0.006 on average and by about 0.020 at most. This is a check within the model. The measurement uses a finite noise sample, so the estimator can slightly exceed 1. Its highest value is 1.0023. No standards-compliant STI measurement was performed.
Decay time at constant total energy
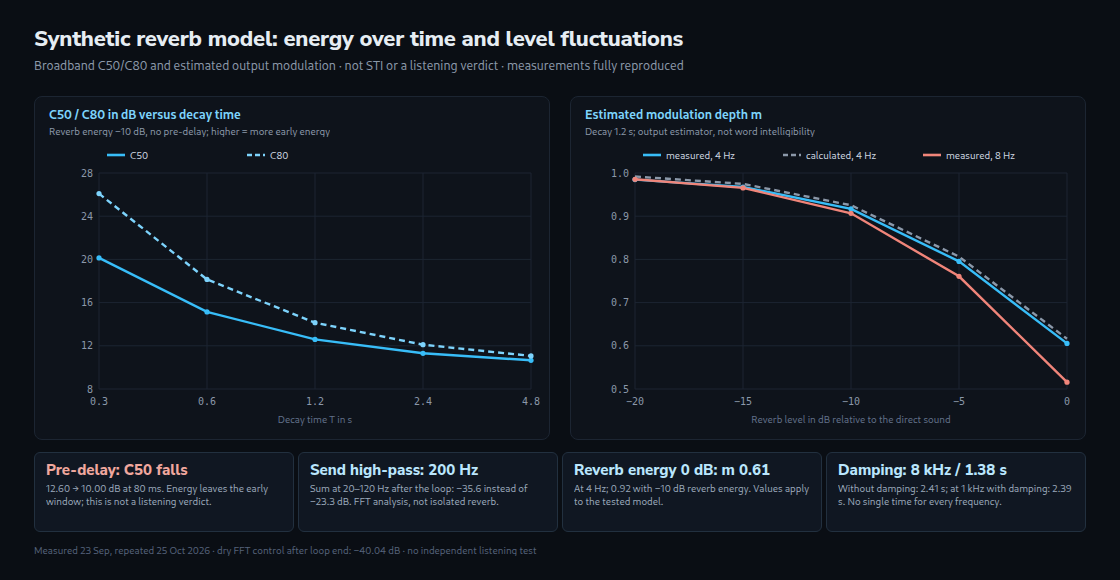
With reverb energy held at −10 dB, the estimated decay times are 0.30, 0.60, 1.20, 2.40 and 4.81 s. The following C50 and C80 values compare early and late energy. Higher numbers mean more early energy within the respective window, not automatically better sound:
| Decay time | C50 | C80 | m at 4 Hz | m at 0.5 Hz |
|---|---|---|---|---|
| 0.3 s | 20.13 dB | 26.09 dB | 0.97 | 0.99 |
| 0.6 s | 15.14 dB | 18.14 dB | 0.94 | 0.99 |
| 1.2 s | 12.60 dB | 14.14 dB | 0.92 | 0.99 |
| 2.4 s | 11.31 dB | 12.10 dB | 0.91 | 0.98 |
| 4.8 s | 10.66 dB | 11.06 dB | 0.90 | 0.95 |
In the ideal model, a longer tail spreads the same reverb energy over more time. Without pre-delay, C50 therefore approaches 10 dB for a reverb energy of −10 dB. For sufficiently fast fluctuations, modulation depth also approaches about 1 / 1.1 = 0.91. The table shows the effect: little changes at 4 Hz between 2.4 and 4.8 s, while slower fluctuations at 0.5 Hz still decrease more. This describes the experiment, not a general rule about long musical phrases.
Changing reverb energy
At a decay time of 1.2 s, increasing reverb energy from −20 to 0 dB reduces C50 from 22.45 to 3.93 dB. Estimated modulation depth at 4 Hz drops from 0.98 to 0.61, and at 8 Hz to 0.52. Eight fluctuations per second have the same rate as eight sixteenth notes per second at 120 BPM. The test signal remains noise, not a sequence of real syllables or notes.
| Reverb level | C50 | C80 | m at 4 Hz | m at 8 Hz |
|---|---|---|---|---|
| −20 dB | 22.45 dB | 23.93 dB | 0.98 | 0.99 |
| −15 dB | 17.49 dB | 18.98 dB | 0.97 | 0.97 |
| −10 dB | 12.60 dB | 14.14 dB | 0.92 | 0.91 |
| −5 dB | 7.95 dB | 9.61 dB | 0.80 | 0.76 |
| 0 dB | 3.93 dB | 5.87 dB | 0.61 | 0.52 |
The comparison suggests a practical test: when reverb covers a vocal too strongly, a useful first comparison is a lower reverb level, followed by different decay times. Reverb energy strongly changes the numbers in these series. This does not establish a universal priority for the send control with every signal, plugin and arrangement.
Pre-delay and the limits of the metrics
Pre-delay is the wait before the reverb response begins. In this experiment, C50 and C80 fall when reverb energy arrives later. This partly follows directly from the fixed 50 and 80 ms windows in those quantities. A lower number therefore does not prove that a voice becomes less intelligible:
| Pre-delay | C50 | C80 | m at 2 Hz | m at 4 Hz |
|---|---|---|---|---|
| 0 ms | 12.60 dB | 14.14 dB | 0.96 | 0.92 |
| 10 ms | 12.04 dB | 13.66 dB | 0.95 | 0.91 |
| 20 ms | 11.51 dB | 13.17 dB | 0.95 | 0.90 |
| 40 ms | 10.50 dB | 12.04 dB | 0.93 | 0.88 |
| 80 ms | 10.00 dB | 10.00 dB | 0.89 | 0.86 |
| 120 ms | 10.00 dB | 10.00 dB | 0.87 | 0.88 |
C50 counts energy before 50 ms as early and energy afterwards as late. At 80 ms pre-delay, the entire tail falls outside that early window, giving 10 dB here. Modulation depth also depends on where the delayed energy arrives within a level fluctuation. As pre-delay increases, the value does not always keep falling at every modulation frequency.
For an isolated onset from silence, 20 ms pre-delay starts that onset’s own tail 20 ms later. During ongoing music, reverb from previous notes may still be sounding. Each new attack therefore does not automatically receive a dry section. Pre-delay can change the impression of distance or separation; a listening comparison determines whether this helps musically. The BPM to delay time calculator converts rhythmic note values into milliseconds.
Damping: the highs decay faster
With a specified decay of 2.4 s, the damped version gives 2.32 s at 125 Hz, 2.39 s at 1 kHz, 2.02 s at 2 kHz, 1.72 s at 4 kHz and 1.38 s at 8 kHz. Without damping, measured octaves range from 2.32 to 2.44 s. Damping lowers the broadband estimate from 2.40 to 1.87 s and raises C50 from 11.31 to 12.12 dB. High frequencies therefore disappear sooner. The decay-time control alone does not describe that behaviour.
Low end in the reverb: the high-pass in the send
The second test uses an artificial kick, bass and hi-hat loop at 128 BPM. A copy of the signal goes to the reverb through a send, while the dry signal remains alongside it. The reverb has a specified time of 1.8 s, 20 ms pre-delay and −10 dB impulse-response energy. A high-pass before the reverb attenuates low frequencies with a slope of 12 dB per octave. The first two result columns compare the wet signal with the dry signal in the same frequency band. The last column measures their sum during the 500 ms after the loop ends.
| High-pass in the send | Reverb 20–120 Hz | Reverb 300 Hz–3 kHz | Sum after loop end (FFT analysis) |
|---|---|---|---|
| none | −10.11 dB | −8.48 dB | −23.3 dB |
| 100 Hz | −17.95 dB | −8.50 dB | −29.0 dB |
| 200 Hz | −28.13 dB | −8.68 dB | −35.6 dB |
| 400 Hz | −39.97 dB | −10.37 dB | −39.1 dB |
Between 20 and 120 Hz, the total level differs from the dry loop by at most 0.33 dB here. That is a small but measurable change. The 200 Hz high-pass reduces the measured remainder after the loop by 12.3 dB; reverb energy between 300 Hz and 3 kHz falls by only about 0.2 dB. At 400 Hz, the midrange contribution also falls by about 1.9 dB. An important limitation is that the ideal FFT band-pass itself causes ringing over time. A dry control measurement still reaches −40.04 dB after the loop is already silent. The table value of −39.1 dB is close to this and must not be interpreted as an isolated reverb tail.
What the model shows
| Goal | Control | Measured value |
|---|---|---|
| Preserve more level fluctuation in the test | lower reverb level | −5 instead of 0 dB: m at 4 Hz 0.80 instead of 0.61 |
| Long tail with low reverb energy | long but quiet reverb | 4.8 s at −10 dB: C50 still 10.66 dB |
| Delay the onset’s own reverb response | pre-delay 20–40 ms | C50 drops by 1.1 to 2.1 dB |
| Reduce the measured remainder | high-pass 100–200 Hz in the send | remainder after the loop −29.0 to −35.6 instead of −23.3 dB |
| Make high frequencies decay faster | damping of the highs | 8 kHz in 1.38 instead of 2.41 s |
Context and limits
The model uses a smoothly decaying noise tail, without separately designed early reflections, moving reverb parameters or stereo. Real rooms and plugins can differ substantially. Early reflections are also not, by definition, always within 50 ms. Here C50 and C80 are broadband calculations based on the early-to-late energy ratio, not complete room measurements according to ISO 3382-1. Modulation depth is neither an STI value nor a percentage of correctly understood words. The results help explain this model; listening effects and useful settings require checking with the relevant material.
Questions and answers
Why do longer decay times change some modulation values only slightly?
In the simplified model, the corner frequency for level fluctuations is approximately 13.8 / (2π·T). With T = 1.2 s this is about 1.8 Hz; with T = 0.3 s it is about 7.3 Hz. The formula describes the speed of loudness fluctuations, not audio treble. Above this corner, the tail increasingly smooths the fluctuations. Without pre-delay, model modulation depth then approaches 1 / (1 + r), where r is the energy ratio of the reverb to the direct impulse.
For reverb energies of −10, −5 and 0 dB, this gives limits of about 0.91, 0.76 and 0.50. The 1.2 s decay series gives measured values of 0.91, 0.76 and 0.52 at 8 Hz. Small deviations arise partly from the finite noise sample. With pre-delay, the time shift means this simple limit no longer applies unchanged.
A calculated example without pre-delay: at 0 dB reverb energy, the model value for 8 Hz fluctuations rises from roughly 0.54 at 1.2 s to 0.77 at 0.3 s. Reverb that is 5 dB lower at 1.2 s gives about 0.76 in the experiment. Different settings can therefore produce similar measurements while sounding different.
Does lowering the send level by 5 dB lower the reverb level by exactly 5 dB?
With an unchanged linear reverb path and a constant dry signal, reducing the send by 5 dB also reduces the wet level by 5 dB. Compression, level-dependent ducking or saturation can change this relationship. The absolute send value still does not reveal the wet/dry ratio: plugin input, output, mix control and signal content also affect it.
Related articles