English
 Deutsch
 Polski
True Peak After Encoding: Measurements, Headroom and Exceptions

Management Summary
Turning a finished recording into a smaller streaming file can change its brief loudest peaks, sometimes pushing them beyond the playback limit. True peak estimates these reconstructed peaks rather than overall loudness. The experiment shows why leaving some level reserve is useful but cannot guarantee every converted version will stay below the limit. Checking the actual delivery formats helps identify possible distortion risks before release; one format’s result does not predict all others.
Contents
- Peaks, loudness and headroom in plain terms
- What was measured
- The −9 LUFS masters: peaks can rise or fall
- The −14 LUFS masters changed less in this test
- The −2 dBTP result includes an important exception
- A 0 dBFS sample ceiling does not control inter-sample peaks
- Why the two peak methods disagree
- Why removing information can increase a peak
- Streaming formats and mastering guidance
- A useful check on an actual master
- Questions and answers
- Sources
Lossy audio encoding can change a master’s peaks. The decoded AAC, MP3, Ogg Vorbis or Opus file can peak higher or lower than the source. A limiter setting alone therefore cannot guarantee that the delivered version stays below full scale. Lossless playback is also available on several services; the lossy path discussed here is not the only delivery path.
This experiment used two synthetic mixes, four master versions of each mix and eleven processing settings: nine lossy encodes and two controls. The archive contains 88 results. The most important finding is the variation between files: some peaks fell, while one AAC file made from a master near −2 dBTP reached +2.93 dBTP in the original measurement. Recommendations such as −1 or −2 dBTP provide a starting point, not a guarantee for every encoder and recording.
A master is the finished audio version prepared for release. Encoding converts that audio into a delivery format. Lossy codecs reduce file size partly by discarding information; decoding turns the stored data back into audio samples. Bitrate, expressed in kbit/s, is the amount of data per second.
Peaks, loudness and headroom in plain terms
A sample is one stored amplitude value. Sample peak is the largest absolute value, so negative peaks count as well. The waveform reconstructed between samples can reach a higher level. A true-peak meter estimates that reconstructed peak. The unit dBTP expresses its level relative to digital full scale. A reading of −1 dBTP leaves about 1 dB of headroom; a positive reading indicates a peak above that reference.
LUFS describes perceived loudness over time, rather than the largest instant. Integrated loudness covers the whole recording. A master at −9 LUFS is louder by this measure than one at −14 LUFS. A limiter reduces peaks; stronger limiting can make a recording louder without increasing its highest sample. These are different measurements, so a low sample peak does not prove a low true peak.
Clipping means that a processing stage cannot represent a peak and cuts it off. Floating-point audio can preserve values above full scale. A later stage may still clip, depending on its numeric range, gain and available headroom. A positive peak is therefore a warning about the playback chain, not proof that every player produces audible distortion.
What was measured
- Material: two synthetic 32-second stereo mixes at 44.1 kHz and 120 BPM. The second mix has louder hi-hats and lead, and more high-frequency pad content. Both were generated in Python and processed with a bus compressor.
- Master targets: A: −8 LUFS with a 0 dBFS sample ceiling. B: −9 LUFS and a true-peak estimate below −1 dBTP. C: −9 LUFS and an estimate below −2 dBTP. D: −14 LUFS and an estimate below −1 dBTP. FFmpeg’s
alimiterwas adjusted repeatedly. The bright C mix reached −9.2 LUFS, so it did not meet the exact loudness target. - Encoding: FFmpeg 7.1.5, native AAC at 128/256 kbit/s, libmp3lame at 128/320, libvorbis at 96/160/320 and libopus at 128/256. Decoding used 32-bit floating-point WAV to retain peaks above full scale.
- Controls: FLAC and sample-rate conversion to 48 kHz with soxr. The FLAC files contain 24-bit integer audio converted from the floating-point masters: lossless compression preserves those integer samples, but the preceding conversion is not bit-identical to the original floating-point file. Peak changes rounded to 0.00 dB. Opus decoding used 48 kHz here; the Opus API also supports 8, 12, 16 and 24 kHz.
- Original peak calculation: a Python implementation using the 48 filter coefficients in Annex 2 of ITU-R BS.1770-5 and fourfold oversampling. Loudness came from FFmpeg’s
ebur128filter. The peak figures were not measured by that filter. - Comparison: FFmpeg with 16-fold soxr oversampling and
astats, keeping floating-point output throughout. This uses a different filter as well as more intermediate points.
Measurement limit: fourfold oversampling of 44.1 kHz produces 176.4 kHz. Annex 2 describes a 48 kHz input and an oversampled rate of at least 192 kHz for the meter designation. The archived figures below retain their original dBTP labels but are identified as the experiment’s 4× estimates; they are not a claim of certified meter compliance. The 16× comparison is a second estimate, not an exact reconstruction of every playback device.
The recordings and encoded files originate from the September 2026 experiment. During the editorial review, selected archived files were decoded and measured again, including both AAC outliers. This was not a new test of streaming-service encoders. Two short synthetic mixes cannot establish universal codec rankings or isolate limiting as the sole cause of a peak change.
The −9 LUFS masters: peaks can rise or fall
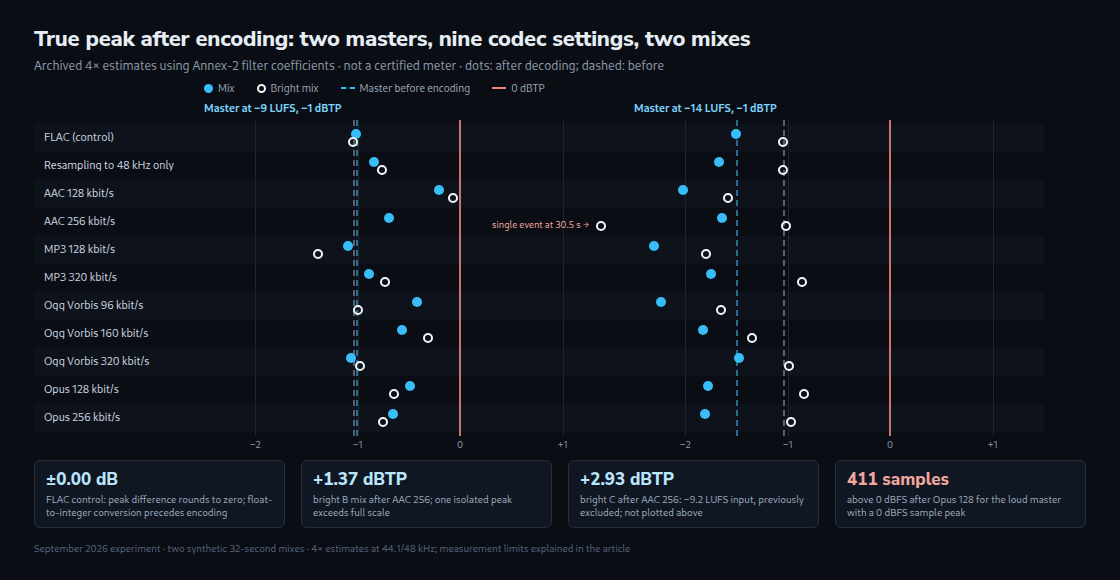
Before encoding, the B masters measured −1.02 dBTP for the mix and −1.05 dBTP for the bright mix. The table uses the original 4× estimates. Changes were calculated before rounding, so displayed values can differ by 0.01 dB when subtracted.
| Codec | Mix after | Change | Bright mix after | Change |
|---|---|---|---|---|
| FLAC (control) | −1.02 dBTP | ±0.00 dB | −1.05 dBTP | ±0.00 dB |
| Resampling to 48 kHz only | −0.85 dBTP | +0.18 dB | −0.76 dBTP | +0.29 dB |
| AAC 128 kbit/s | −0.21 dBTP | +0.81 dB | −0.07 dBTP | +0.98 dB |
| AAC 256 kbit/s | −0.70 dBTP | +0.32 dB | +1.37 dBTP | +2.42 dB |
| MP3 128 kbit/s | −1.09 dBTP | −0.07 dB | −1.39 dBTP | −0.34 dB |
| MP3 320 kbit/s | −0.89 dBTP | +0.13 dB | −0.74 dBTP | +0.31 dB |
| Ogg Vorbis 96 kbit/s | −0.43 dBTP | +0.59 dB | −1.00 dBTP | +0.05 dB |
| Ogg Vorbis 160 kbit/s | −0.57 dBTP | +0.45 dB | −0.31 dBTP | +0.74 dB |
| Ogg Vorbis 320 kbit/s | −1.07 dBTP | −0.05 dB | −0.98 dBTP | +0.07 dB |
| Opus 128 kbit/s | −0.49 dBTP | +0.53 dB | −0.65 dBTP | +0.40 dB |
| Opus 256 kbit/s | −0.65 dBTP | +0.37 dB | −0.75 dBTP | +0.30 dB |
Fifteen of the eighteen lossy encodes increased the peak. MP3 128 reduced it in both mixes; Vorbis 320 reduced it in the first mix. AAC 128 increased the peak by 0.81 and 0.98 dB. The bright AAC 256 file had a larger isolated peak: +1.37 dBTP, an increase of 2.42 dB. Re-decoding the archived file reproduced this result. This is a result for the FFmpeg encoder and this file, not a prediction for Apple’s encoder.
For these B masters, MP3 128 reduced integrated loudness by 0.5 LU in both mixes. The other lossy settings changed loudness by no more than 0.2 LU. Removing high frequencies does not necessarily reduce the highest peak: changing the combination of frequency components can also increase it.
The −14 LUFS masters changed less in this test
The D masters started at −1.51 dBTP and −1.05 dBTP. Across their eighteen lossy encodes, the highest result was −0.84 dBTP, for Opus 128 in the bright mix. The corresponding MP3 320 result was −0.86 dBTP. In the first mix, the largest result was −1.48 dBTP, for Vorbis 320.
These two master versions needed less limiting and showed smaller upward changes than the B versions. That association is useful, but it does not establish that −14 LUFS always makes a −1 dBTP ceiling sufficient. Different recordings, filters and encoders can behave differently.
The −2 dBTP result includes an important exception
The first C master reached −9 LUFS and −2.05 dBTP. Its highest encoded peak was −0.89 dBTP with AAC 128. All other settings stayed at or below −1.57 dBTP.
The bright C master was previously excluded from the main comparison because it reached only −9.2 LUFS instead of −9 LUFS. That prevents an exactly equal-loudness comparison, but the file still matters when assessing headroom: its original peak was −2.05 dBTP, and its AAC 256 version reached +2.93 dBTP. Re-decoding the archived file reproduced +2.93 with the 4× method and +2.96 with the 16× comparison. Even its sample peak was positive, at +2.34 dBFS.
Thus the archive does not support the claim that a −2 dBTP master always stays below zero after encoding. The exceptional result also does not establish how often this occurs. The practical consequence is to measure encoded versions of the actual master, including isolated peaks.
A 0 dBFS sample ceiling does not control inter-sample peaks
The A masters reached −8 LUFS. Before encoding, their 4× peak estimates were already +0.37 and +1.03 dBTP despite the 0 dBFS sample ceiling. AAC 128 reached +2.29 dBTP in the first mix; AAC 256 reached +2.23 in the bright mix. The lossy decoded files contained between 14 and 411 sample values above full scale, counting both channels.
AES TD1008 describes possible clipping in fixed-point decoders and gain reduction in some operating-system playback paths. These are possible downstream behaviours, not measurements of a particular player in this experiment. No listening test or device-by-device playback test was performed.
Why the two peak methods disagree
| Value | Original 4× estimate | 16× soxr comparison |
|---|---|---|
| Master B, mix, before encoding | −1.02 dBTP | −0.80 dBTP |
| Master B, bright mix, before encoding | −1.05 dBTP | −0.54 dBTP |
| Resampling to 48 kHz only, rise (mix / bright mix) | +0.18 / +0.29 dB | −0.01 / ±0.00 dB |
| Master B, encodings above 0 dBTP | 1 (AAC 256) | 2 (AAC 256, Ogg Vorbis 160) |
| Master C, mix, highest value after encoding | −0.89 dBTP | −0.77 dBTP |
| Master D, highest value after encoding | −0.84 dBTP | −0.84 dBTP |
| Master D, mix, before encoding | −1.51 dBTP | −1.66 dBTP |
| Bright C master before encoding (−9.2 LUFS) | −2.05 dBTP | −1.69 dBTP |
| Bright C after AAC 256 (new archive check) | +2.93 dBTP | +2.96 dBTP |
More oversampling calculates more points between the stored samples. It can find a peak that a coarser calculation misses. Filter choice also changes the estimate: the D master in the first mix measured 0.15 dB lower with the 16× method. The comparison therefore cannot be described as a fixed correction of up to 0.5 dB.
For the bright B master, Vorbis 160 also exceeded zero in the 16× comparison, at +0.21 dBTP. The apparent increase from sample-rate conversion alone became very small with that method. This shows sensitivity to the measurement method; it does not prove that sample-rate conversion can never change peaks.
EBU Tech 3343 discusses an under-read of about 0.5 dB for a 4× meter at 48 kHz. That statement is not a universal maximum error for every signal or filter, and it does not directly validate this experiment’s 44.1 kHz implementation.
Why removing information can increase a peak
A peak depends on how the signal’s components add together at a particular instant. Removing a component can remove cancellation as well as energy. AES gives a simple example: the fundamental sine wave inside a square wave has amplitude 4/π, about 1.27 times the square wave’s amplitude. Removing the other harmonics leaves a sine wave whose peak is about 2.1 dB higher, even though total energy falls.
Lossy codecs change frequency components and can change timing through their filters. Sample-rate converters also filter the signal. These operations can raise or lower peaks. A higher bitrate is not a universal promise of lower peaks: the bright AAC 256 exceptions and the MP3 results in this archive demonstrate that limitation.
Streaming formats and mastering guidance
The format actually delivered depends on the service, subscription, device and quality setting. The following overview describes documented options, not measurements of service output.
| Service | Lossy | Lossless |
|---|---|---|
| Spotify | App: levels of about 24, 96, 160 and 320 kbit/s, Ogg Vorbis for most tracks according to the developer documentation; web player AAC 128 kbit/s (Free) and 256 kbit/s (Premium) | FLAC up to 24-bit/44.1 kHz (Premium) |
| Apple Music | AAC, at 256 kbit/s according to Apple Digital Masters | ALAC lossless; availability depends on device and settings |
| YouTube Music | AAC and Opus at up to 48, 128 or 256 kbit/s | No lossless tier specified in the cited quality settings |
| Amazon Music | Opus at 48, 192 or 320 kbit/s (SD) | FLAC (HD and Ultra HD) |
| Deezer | MP3 at 64, 128 or 320 kbit/s | FLAC, CD quality (16-bit/44.1 kHz) |
Deezer labels its FLAC tier “1411 kbit/s”. That corresponds to the uncompressed rate of stereo 16-bit/44.1 kHz PCM; the compressed FLAC file does not have to use that fixed bitrate. Amazon’s developer table is explicitly preview documentation. Neither table establishes the exact encoder used for a particular stream.
- Spotify: recommends −14 LUFS integrated loudness and true peak below −1 dBTP; for masters louder than −14 LUFS, below −2 dBTP. These are recommendations, not a guarantee against every encoded peak.
- Apple Digital Masters: recommends at least 1 dB of headroom and provides tools including
afclipfor checking encoded results. - AES TD1008: recommends a maximum of −1 dBTP at the input of lossy streaming codecs. Additional headroom may be needed for a particular processing chain.
- EBU R 128 and Tech 3343: concern broadcast production and distribution. A production ceiling is not automatically a guarantee for every lossy music service.
A useful check on an actual master
A test encode shows how one encoder and setting affect a recording. For example, ffmpeg -n -i master.wav -c:a aac -b:a 128k probe.m4a creates an AAC test file and refuses to overwrite an existing output. Measuring the decoded file with a suitable true-peak meter reveals both the largest peak and the remaining headroom. Other target formats and bitrates need their own checks. This FFmpeg example does not reproduce a service’s private encoding pipeline.
The site’s LUFS and True Peak Meter offers a browser-based check. Browser decoding and sample-rate conversion can affect the result, so a browser reading should not be assumed to match a mastering plug-in or the historical calculation above.
Questions and answers
Does a −2 dBTP ceiling guarantee a safe encoded file?
No. It provides more headroom than −1 dBTP, and Spotify recommends it for louder masters. The archived bright C example still exceeded zero after AAC 256 encoding. The relevant check is the decoded version of the actual recording.
Is an MP3 128 test enough?
No. In the B examples, MP3 128 lowered peaks while AAC 128 raised them. A result from one codec cannot establish the behaviour of another. Even two settings of the same codec can produce different peak locations and heights.
Does loudness normalisation prevent clipping?
Attenuation can reduce a preserved peak. A simple 5 dB reduction would change +1.37 dBTP to −3.63 dBTP. It cannot restore a peak already clipped earlier in the chain. Normalisation must also be active: Spotify documents exceptions for the web player and third-party devices, as well as different loudness settings and album behaviour.
Does lowering the peak ceiling cost loudness?
Lowering the whole signal by 1 dB also lowers integrated loudness by about 1 LU. Keeping the same loudness while lowering the peak ceiling requires changing the waveform, for example through stronger limiting. The first B and C masters both reached −9 LUFS, but used different limiter settings. The bright C master did not reach that exact target. The choice also affects sound and dynamics, which peak measurements alone do not assess.
Sources
- ITU-R BS.1770: Algorithms to measure audio programme loudness and true-peak audio level
- AES TD1008: Recommendations for Loudness of Internet Audio Streaming and On-Demand Distribution
- EBU R 128: Loudness normalisation and permitted maximum level of audio signals
- EBU Tech 3343: Guidelines for Production of Programmes in accordance with R 128
- Loudness normalization – Spotify for Artists
- Audio quality – Spotify
- Media Delivery – Spotify for Developers
- Apple Digital Masters
- Apple Music
- Audio quality settings – YouTube Music Help
- Audio Formats – Amazon Music Developer
- Deezer Audio Quality
- FFmpeg Codecs Documentation
- Opus 1.5: Decoder API and supported sample rates
- MDN: Audio decoding and resampling with decodeAudioData
- Apple Support: Lossless audio in Apple Music
Related articles