Tutorial: Measuring Token Consumption per Request and Enforcing a Monthly Budget

Contents
A bill for an API arrives once a month and states a total. Between that total and the code that produced it usually sits nothing at all – no record of which feature spent what, and no way to tell an expensive week from an expensive habit.
The gap is easy to close, because the information is already in every response. The work below is twenty lines of logging, one conversion table, and one check that runs before the request rather than after it.
Where the True Number Already Is
Every response from a chat completion carries a usage block. It is not an estimate and not a rounding; it is what the meter recorded.
{
  "usage": {
    "input_tokens": 12400,
    "cache_creation_input_tokens": 8200,
    "cache_read_input_tokens": 96000,
    "output_tokens": 1850
  }
}
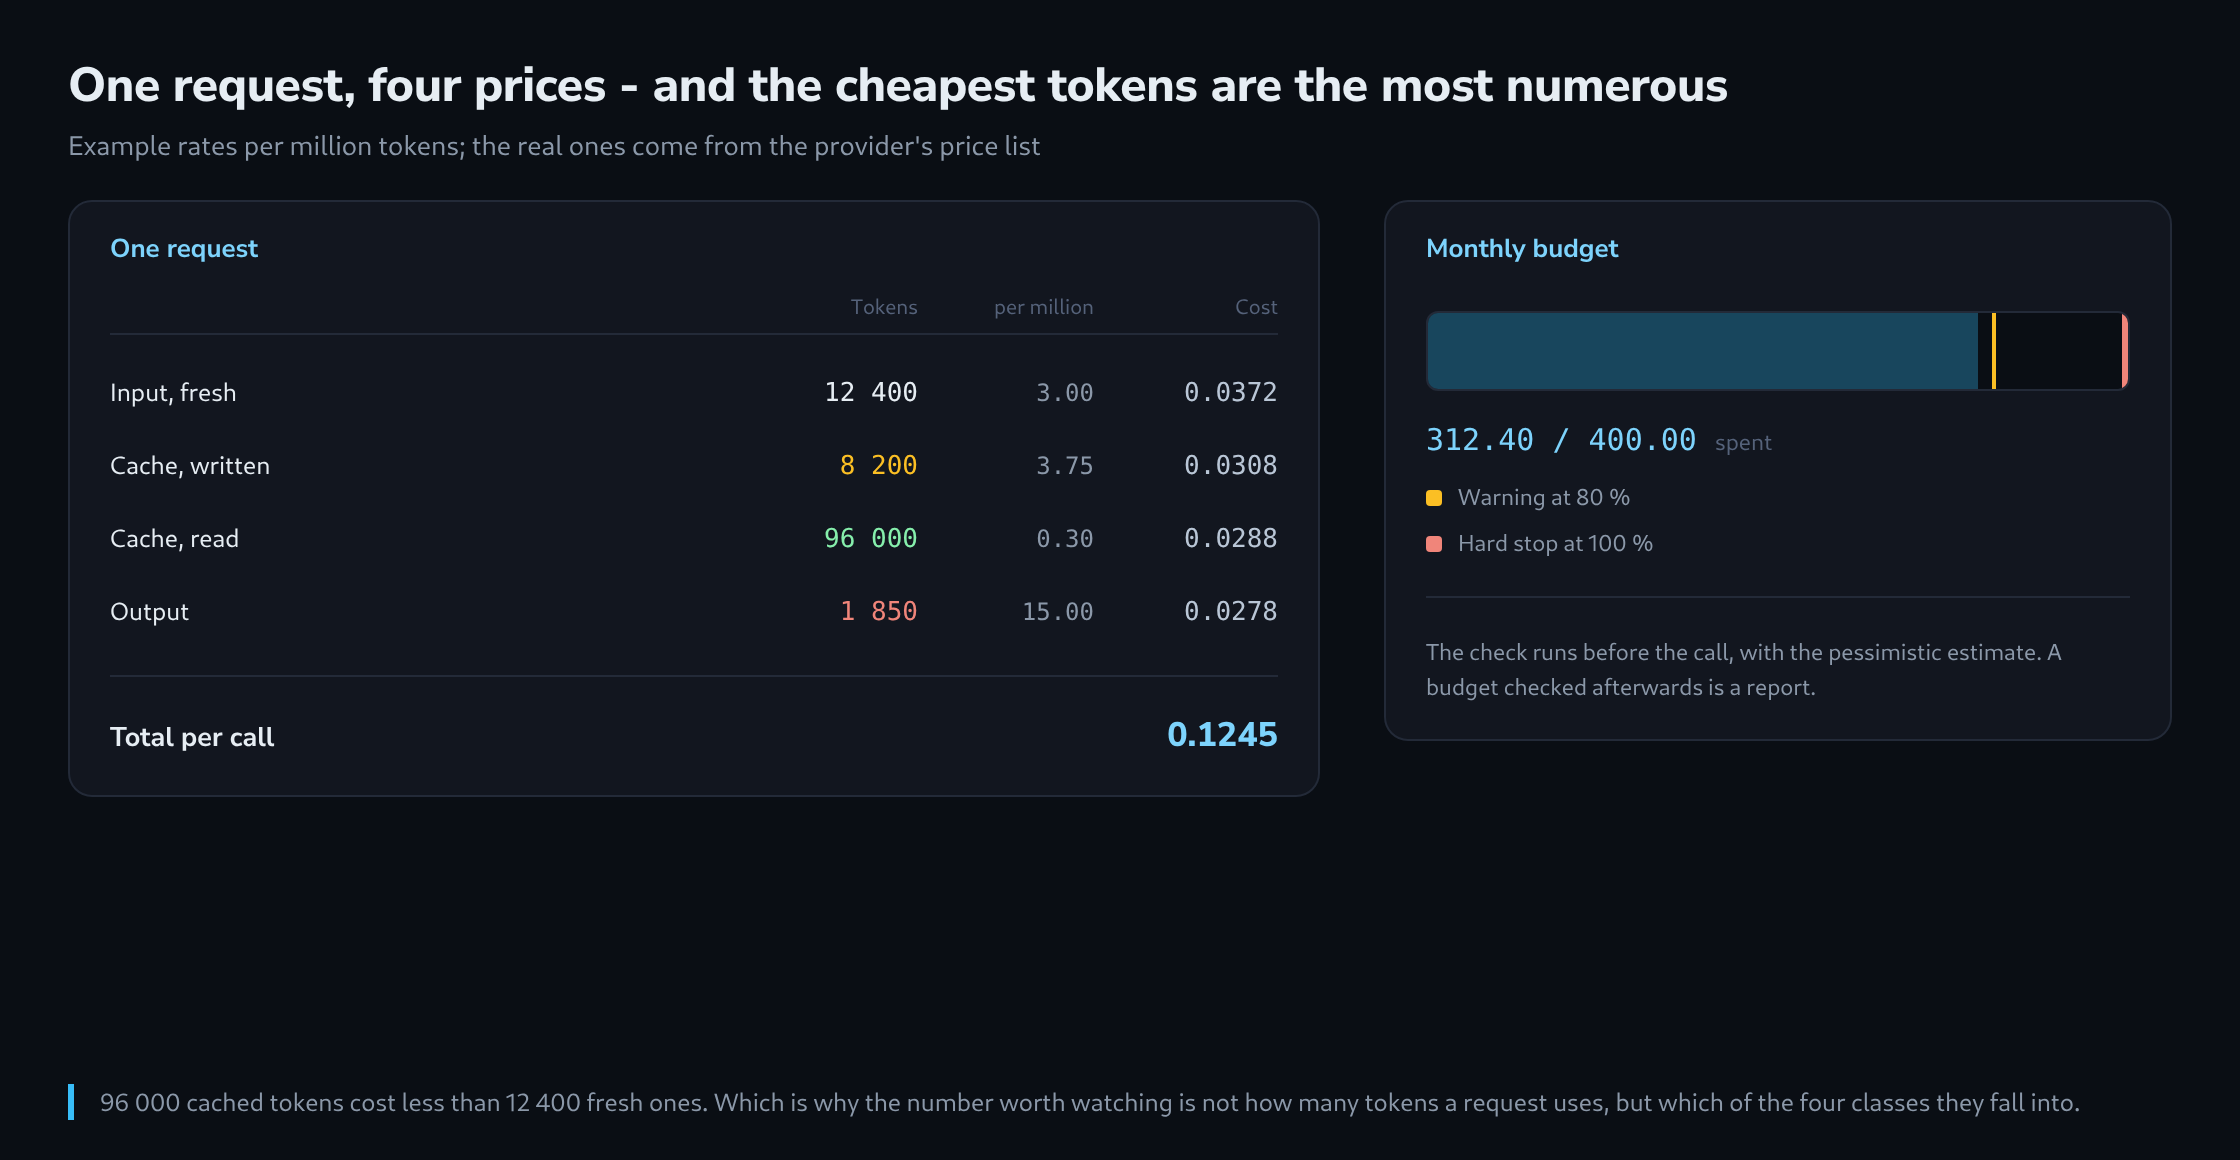
The four fields are four separate prices, and the split matters more than the sum. Freshly sent input is the base rate. Tokens written into a prompt cache cost a surcharge once. Tokens read back out of that cache cost a fraction of the base rate. Output is the most expensive class of all, usually several times the input rate.
Other providers name the same things differently – prompt_tokens, completion_tokens and a nested cached_tokens are the common alternative – but the structure is the same, and so is the consequence: a single number labelled “tokens” cannot be converted into money.
Streaming needs one extra note. The usage block does not arrive with the first chunk but at the end, in the closing event of the stream. Code that reads the text and discards the rest therefore loses exactly the part that costs something.
Counting Before Sending
Sometimes the number is needed before the request exists – to decide whether a document still fits, or whether a conversation has to be shortened. For that there is a counting endpoint, which is free and returns what the model would see.
curl https://api.anthropic.com/v1/messages/count_tokens \
  -H "x-api-key: $API_KEY" \
  -H "anthropic-version: 2023-06-01" \
  -H "content-type: application/json" \
  -d '{
    "model": "claude-sonnet-5",
    "messages": [{"role": "user", "content": "..." }]
  }'
A local tokeniser answers the same question without a network call and is close enough for a length check, but it is not the meter. System prompts, tool definitions and image blocks all add tokens that a text tokeniser never sees, and the difference runs to thousands on a request with tools attached. For a budget, only the usage block counts.
One Row per Request
The logging itself is unremarkable, and its value lies entirely in the fields that describe the context rather than the request. Model and token counts alone answer nothing; a label saying which feature made the call answers almost everything.
import json, sqlite3, time, uuid

DB = sqlite3.connect("verbrauch.db")
DB.execute("""CREATE TABLE IF NOT EXISTS aufrufe (
    id TEXT PRIMARY KEY, zeit INTEGER, modell TEXT, zweck TEXT,
    ein INTEGER, cache_neu INTEGER, cache_gelesen INTEGER, aus INTEGER,
    kosten REAL, versuch INTEGER)""")

def buchen(antwort, modell, zweck, versuch=1):
    u = antwort["usage"]
    zeile = dict(
        id=str(uuid.uuid4()), zeit=int(time.time()), modell=modell, zweck=zweck,
        ein=u["input_tokens"],
        cache_neu=u.get("cache_creation_input_tokens", 0),
        cache_gelesen=u.get("cache_read_input_tokens", 0),
        aus=u["output_tokens"], versuch=versuch)
    zeile["kosten"] = kosten(modell, zeile)
    DB.execute("INSERT INTO aufrufe VALUES (:id,:zeit,:modell,:zweck,:ein,"
               ":cache_neu,:cache_gelesen,:aus,:kosten,:versuch)", zeile)
    DB.commit()
    return zeile["kosten"]
The versuch column is the one that pays for itself unexpectedly. A retry after a timeout sends the whole input again and is billed again, while the application sees one logical call. Without that column, retries hide inside the average and a bad afternoon looks like an expensive feature.
Turning Tokens into Money
Prices belong in one place, per model and per token class, expressed per million tokens because that is how they are published.
# Example rates in currency per million tokens - the real ones
# come from the provider's price list and change over time.
PREISE = {
    "claude-sonnet-5": {"ein": 3.00, "cache_neu": 3.75, "cache_gelesen": 0.30, "aus": 15.00},
}

def kosten(modell, z):
    p = PREISE[modell]
    return round(sum(z[k] * p[k] for k in ("ein", "cache_neu", "cache_gelesen", "aus")) / 1e6, 6)
Applied to the request above, the four classes come out at 0.0372, 0.0308, 0.0288 and 0.0278 – together 0.1245 per call. The interesting comparison is the third figure against the first: 96 000 tokens read from cache cost less than 12 400 sent fresh. A cache that is being hit does not merely reduce the bill, it changes which part of the request dominates it.
With a few days of rows in the table, the useful question becomes answerable in one statement.
SELECT zweck,
       COUNT(*)                          AS aufrufe,
       ROUND(SUM(kosten), 2)             AS gesamt,
       ROUND(AVG(kosten), 4)             AS je_aufruf,
       ROUND(100.0 * SUM(cache_gelesen) /
             NULLIF(SUM(ein + cache_neu + cache_gelesen), 0), 1) AS cache_anteil
FROM aufrufe
WHERE zeit >= strftime('%s', 'now', 'start of month')
GROUP BY zweck ORDER BY gesamt DESC;
The Guard That Actually Stops Something
A budget that only warns is a report. Stopping requires the check to sit in front of the call, and it requires a number that is current rather than nightly.
class BudgetErschoepft(Exception):
    pass

MONATSBUDGET = 400.0
WARNSCHWELLE = 0.80

def monatssumme():
    (s,) = DB.execute(
        "SELECT COALESCE(SUM(kosten), 0) FROM aufrufe "
        "WHERE zeit >= strftime('%s', 'now', 'start of month')").fetchone()
    return s

def pruefen(geschaetzte_kosten):
    verbraucht = monatssumme()
    if verbraucht + geschaetzte_kosten > MONATSBUDGET:
        raise BudgetErschoepft(f"{verbraucht:.2f} von {MONATSBUDGET:.2f} verbraucht")
    if verbraucht > MONATSBUDGET * WARNSCHWELLE:
        logging.warning("Budget zu %.0f %% verbraucht", 100 * verbraucht / MONATSBUDGET)
Three decisions turn this from a formality into something that holds. The estimate passed in should be the pessimistic one – maximum output tokens at the output rate – because a call is either allowed or not, and being allowed on an optimistic estimate is how a budget gets exceeded by exactly one request.
The second is what happens when the exception is raised. A batch job should stop and say where it stopped. An interactive feature should degrade rather than fail: a smaller model, a shorter context, or a queue that resumes next month. Both are better than a stack trace reaching a user.
The third is that a shared budget needs a shared counter. Several processes each holding their own total will each stay under the limit and jointly exceed it. A single table with a transaction around read and write, or a counter in a shared store, is the whole fix.
What the Guard Cannot See
Three kinds of spend never pass the check, and each has its own way of being caught.
Batch processing is billed at a discount and often runs asynchronously, so the usage block arrives hours later with the results. Its cost belongs in the same table, entered when the results are fetched, with the submission time rather than the fetch time – otherwise a month boundary lands the spending in the wrong month.
Failed requests are the second. A call that runs into a timeout after the model has already generated most of its answer is still billed, and it produces no usage block to read. What it does produce is a request identifier in the response headers, and the provider’s own usage report will carry it. A monthly reconciliation between the local table and that report takes ten minutes and finds exactly this class of difference.
And the third is everything that is not a chat completion: embeddings, transcriptions, image generation, a search tool called on the server side. Each has its own meter and its own price, and none of them appears in the usage block being logged here. The reconciliation catches those too, which is the practical reason to do it at all.
Sources
Related articles