English
 Deutsch
 Polski
Four Kinds of Number in a Conversion Report: Counted, Modelled, Projected and Estimated With a Range

Management Summary
Sales and advertising reports combine different kinds of numbers: recorded activity, estimates that fill measurement gaps, projections and ranges expressing uncertainty. These figures answer different questions about observed results and likely outcomes. Understanding their meaning helps prevent a precise-looking report from creating false confidence in a business decision. Estimates may overlap with recorded purchases, so adding every figure can count the same outcome twice. Clear definitions make comparisons more useful.
Jump to the interactive example ↓
Contents
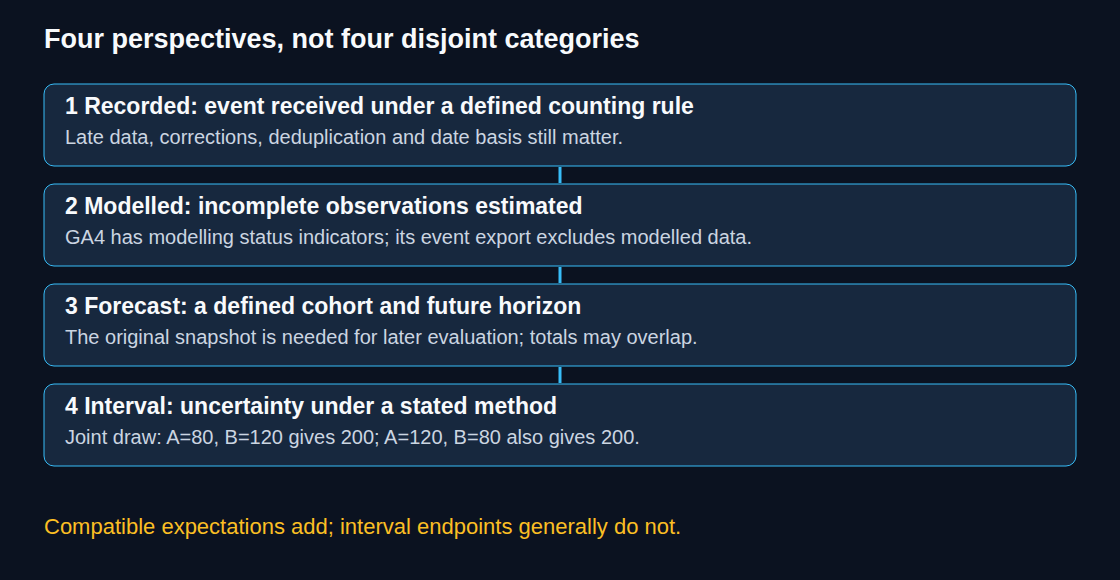
A conversion report can combine recorded events, estimates for missing observations, forecasts and estimates accompanied by an uncertainty interval. These are four useful reporting perspectives, not four mutually exclusive statistical categories. A forecast is also modelled, and both past estimates and future forecasts can have intervals.
A number becomes interpretable when the report states what was measured or estimated, for which population and period, using which rules, and as of which extraction date. Typography alone cannot provide those answers.
Counted: recorded under defined rules
A recorded event is evidence that the measurement system received an event, not proof that every real conversion was captured exactly once. Duplicate events, missing tracking and the definition of a conversion still matter. Google Ads, for example, distinguishes counting every conversion from counting one conversion per ad interaction for a conversion action.
Counts can change through delayed processing and corrections. Google Ads conversion adjustments distinguish retractions, which affect the count, from restatements, which change value. Closing an attribution window does not make every published figure permanently immutable. Reproducibility requires a preserved data snapshot, query, configuration and definition.
Counts for disjoint periods can be added when the counting rules and date basis are consistent. Distinct people cannot simply be added across months if the same person appears in both. Rates need their numerators and denominators, rather than addition of the displayed percentages.
Modelled: an estimate for an incompletely observed quantity
Consent mode can support different kinds of modelling. GA4 behavioral modelling estimates behaviour when persistent identifiers are unavailable, using similar observed users as training data. Conversion modelling is a different use of models; its rules should not be replaced with the eligibility thresholds for behavioral modelling.
In GA4, behavioral modelling depends on eligibility and the reporting identity. The data-quality icon and, on some pages, banners indicate inclusion, exclusion or unavailability of estimated user data. A report may combine observations and estimates without providing a separate modelled amount for every row, but that is different from having no indication at all.
GA4’s BigQuery event export does not include its modelled data. This is a limit of that export, not of BigQuery as a storage system: results from other models can be stored there. A mismatch with the interface is also not proof of modelling. Time zones, metric scope, filters, export completeness, processing delays and calculation methods can cause differences.
Projected: a defined target in the future
A forecast estimates a future outcome from information available at a particular time. Google describes Qualified Future Conversions (QFC) as a signal connecting ad exposure and subsequent leading actions, such as branded searches, to expected future conversions. Its published lead-generation overview describes a horizon of up to six months.
The actual account metric, horizon, availability and reporting definition need confirmation before use. The general announcement does not establish identical columns or a current pilot status for every account. A forecast of total outcomes and a forecast of remaining outcomes are different quantities; adding either indiscriminately to recorded conversions risks double counting.
A forecast can be evaluated after its target period matures, allowing for reporting delay. That requires the original forecast snapshot, the group of cases it concerns (the cohort), its target date and its evaluation rule. A later value in the same column may be a revised forecast. Missing observation of eventual outcomes also limits validation; an attributed forecast is not automatically proof of causal advertising lift.
Estimated with a range: uncertainty needs a definition
A marketing mix model can estimate an incremental contribution and publish a central value with an interval. The interval type and level belong beside the number. For a Bayesian 90% credible interval, the model assigns a 90% probability to the estimated quantity lying within the interval, after combining the observed data with prior assumptions. A frequentist 90% confidence procedure has a different meaning: across many repeated samples, about 90% of the resulting intervals would contain the fixed true value, provided the method’s assumptions hold. A prediction interval concerns a future observation rather than only a model parameter.
No interval automatically covers every source of error. Missing confounders, poor measurement or an unsuitable model can make a narrow interval misleading. Google Meridian therefore recommends assessment of model assumptions and results, not prediction accuracy alone. An interval is valuable information, not an automatic quality certificate.
What may be added?
Expected counts for compatible, non-overlapping groups can be added, including modelled or projected counts. For expectations, E(A+B)=E(A)+E(B) does not require independence. This does not license adding overlapping attributed conversions, different outcomes, ratios or incompatible forecasts.
Uncertainty also depends on which values can occur together. This is described by the joint distribution. Quantiles and interval endpoints generally do not add. In a toy example, four equally weighted joint scenarios assign channel A values 80, 90, 110, 120 and channel B values 120, 110, 90, 80. Every paired total is 200. Adding the separate minimum and maximum values produces 160–240, which is not the range of the paired totals. This illustrates dependence, not a fitted marketing model or a credible interval.
For posterior samples, compatible outcomes are summed within each shared draw first; the interval is then calculated from those sums. Independently rearranging the channel samples loses their dependence. The joint model also determines whether contributions have an additive definition in the first place.
Questions and answers
Does an export mismatch identify a modelled number?
No. A counted metric can fail to match because the export is incomplete or the query uses different rules. Conversely, a model estimate can be reproducible when the data, model, software and random state are preserved. The definition and processing path are stronger evidence than a simple equality test.
Can months with different modelling status be compared?
Only with the break in method made explicit. A consistently defined observed-data series can help, but changing consent rates or tracking coverage can still change its composition. An export does not automatically make two periods comparable.
Which date belongs to a conversion?
Google Ads primary conversion columns generally assign results to the ad-click date; separate “by conv. time” columns use the conversion time. A purchase in October following a September click can therefore appear under different months in two valid reports. The chosen date basis and extraction date belong in the report.
How should a result be stated?
For example: “620 deduplicated recorded purchases in September, extracted on 10 October under definition V3”; “estimated total under the stated model”; or “expected outcomes for the defined cohort by the stated horizon”. An interval needs its level and method. For an agreed reporting KPI, the definition, revision policy and extraction date matter more than a blanket rule allowing only counted values.
Sources
- Google Ads: Conversion counting options
- Google Ads: Conversion columns and time of conversion
- Google Ads: Conversion adjustments
- Google Analytics: Behavioral modeling for consent mode
- Google Analytics: Reporting surfaces and BigQuery event export
- Google: Qualified future conversions
- Google: Lead generation launches and future conversion signals
- Google Meridian: Assessing model fit and posterior results
- Google Meridian: Analyzer aggregation and credible intervals
- NIST: Confidence limits and their interpretation
Learn by trying
A better purchase rate – or different measurement gaps?
The example truth stays fixed: 1,000 visits, 100 purchases. Change only what reaches the report.
- Measured visits
- Measured purchases
- Reported purchase rate
Toy model: 100 buyer visits with one purchase each and 900 visits without purchase. Capture rates are known model inputs. Not a reproduction of a specific GA4 metric or Google modelling. Real missing purchases cannot be reconstructed from the measured rate alone.
This module runs in your browser and does not send or store your input.
Learn by trying
One minute: can you spot the mistake?
The measured purchase rate rises after tracking changes. Does that prove more real purchases?
If buyer visits are tracked more often than other visits, the measured rate rises without real improvement. Comparisons need consistent tracking and denominators. We know the truth here only because the example is constructed.
Find the hidden problems
Simplified learning model
Find the hidden problems
Each example hides three problems. Click a suspicious area and explain your suspicion.
Choose an area. Is it a problem, or is it fine in this example?
Fictional, deliberately simplified examples. Each area gives its full context; this does not assess your own website or devices.
These examples run only in your browser. No real systems are disrupted.
PNG with settings, result and article link. Created locally only when you click.
Related articles