English
 Deutsch
 Polski
Clipper or Limiter: Peaks and Aliasing Before Export

Management Summary
Clippers and limiters control brief loud peaks when preparing music for release. A clipper cuts or rounds those peaks; a limiter lowers the level around them. Both can make a recording louder, but also change its sound. The comparison shows why the choice depends on the desired character and enough room for peaks: conversion to streaming formats can create new peaks even after limiting. Listening at equal loudness and checking the finished file help balance loudness, sound and distortion risk.
Contents
A clipper and a limiter both control peaks, but change the waveform differently. A hard clipper cuts off values above a threshold. A soft clipper bends the waveform more gradually. A limiter lowers gain around a peak over a period of time. The practical comparison needs equal loudness, a check of the encoded file and a listening test.
This September 2026 experiment compares six FFmpeg processing paths on one synthetic mix and a test tone. It measures peak changes and unwanted frequency components. It does not establish which plug-in sounds best. The mix also appears in the article True Peak After Encoding.
A master is the finished audio version prepared for release. Harmonics are components at integer multiples of a fundamental frequency. Here, attack determines how quickly the limiter reaches its reduction; release describes the return towards the original gain.
The terms behind the comparison
A sample is one stored amplitude value. Sample peak is the largest absolute value, including negative peaks. True peak estimates how high the reconstructed waveform reaches between samples. A setting of −1 dBFS for samples is therefore different from a measured −1 dBTP peak. Integrated loudness in LUFS describes loudness over the whole recording. Matching LUFS makes loudness more comparable; it does not make the sound identical.
Aliasing creates frequency components that do not belong at those frequencies in the original signal. A sampled signal cannot uniquely represent frequencies above half its sample rate. At 44.1 kHz, this boundary is 22.05 kHz. Clipping generates additional harmonics; components above that boundary can reappear at lower frequencies.
Oversampling temporarily processes the signal at a higher sample rate. Filters remove high-frequency components before conversion back. This can reduce aliasing, but does not guarantee its complete removal or an unchanged output peak.
What the experiment actually did
- Six paths: FFmpeg 7.1.5
alimiter, hard clipping and the smoothtanhcurve ofasoftclip. Each ran at 44.1 kHz and with external 4× soxr conversion to 176.4 kHz and back. The nominal sample threshold was −1 dBFS. The limiter used 5 ms attack/look-ahead, 50 ms release and no automatic level compensation. - Test tone: 6.2 kHz, with its input peak 6 dB above the threshold. A one-second middle section was analysed. Energy within 30 Hz either side of the fundamental and its second and third harmonics was excluded from the residual; frequencies below 20 Hz were also excluded. The remaining energy is reported relative to the fundamental.
- Mix: one synthetic 32-second stereo recording, initially −18.5 LUFS. Input gain was adjusted separately for targets of −12, −10 and −8 LUFS. Eighteen masters were each encoded to AAC 256, MP3 320 and Opus 128 kbit/s, giving 54 codec results.
- Peaks: the historical 4× Python estimate uses Annex-2 coefficients from ITU-R BS.1770-5. At 44.1 kHz that produces 176.4 kHz, below the 192 kHz oversampled rate described for the meter designation in Annex 2. The dBTP labels are retained as archived estimates, without claiming certified compliance. A 16× soxr calculation supplies a separate comparison.
- Waveform comparison: delay and a constant gain were aligned with the source. The calculation compares processed-signal energy with remaining difference energy. A larger ratio means less residual difference after that alignment. This is not a listening score.
The built-in asoftclip oversampling was not used in the six paths. A targeted recheck with FFmpeg 7.1.5 reproduced a nearly pure sine with the hard curve at factors 4 and 8, despite an input above the clipping threshold; factor 2 still produced harmonics. This is a specific implementation observation, not evidence that all internal oversampling is defective.
The sine test: less residual energy with oversampling
| Method | Harmonics in the analysis bands | Residual energy / fundamental | Strongest lines | Sample peak | True peak |
|---|---|---|---|---|---|
| Limiter | Not resolved | −83 dB | 6.1 and 6.3 kHz | −1.00 dBFS | −0.82 dBTP |
| Limiter, 4 times | Not resolved | −135 dB | – | −1.00 dBFS | −0.82 dBTP |
| Hard clipper | −12.9 dB | −25 dB | 13.1, 11.7 and 0.7 kHz | −1.00 dBFS | +0.50 dBTP |
| Hard clipper, 4 times | −12.9 dB | −51 dB | 9.0 and 3.4 kHz | −0.39 dBFS | −0.14 dBTP |
| Soft clipper | −15.5 dB | −28 dB | 13.1 and 0.7 kHz | −1.32 dBFS | −0.94 dBTP |
| Soft clipper, 4 times | −15.5 dB | −136 dB | – | −1.29 dBFS | −0.72 dBTP |
The table’s residual is not an exclusive aliasing measurement. For the direct limiter it includes sidebands near 6.1 and 6.3 kHz, consistent with changing gain. At very low levels it also includes numerical and analysis residuals. Thus −136 dB does not mean that every possible alias component has been independently identified or that a plug-in is audibly perfect. “Not resolved” in the harmonic column means negligible in this calculation, rather than mathematically absent.
The hard clipper generated strong folded components at 13.1, 11.7 and 0.7 kHz. Its combined residual was about −25 dB relative to the fundamental, compared with −28 dB for the soft curve. External 4× processing reduced those figures to approximately −51 and −136 dB. Stanford’s Julius O. Smith explains why smoother nonlinear curves and appropriate oversampling with filtering can reduce aliasing.
The nominal threshold did not guarantee the final peaks. Direct hard clipping held samples at −1.00 dBFS, while the 4× peak estimate reached +0.50 dBTP. With external oversampling, conversion back to 44.1 kHz produced a sample peak of −0.39 dBFS. Filters can change the shape of an already clipped waveform and create overshoot.
The mix: equal loudness does not mean equal peak level
| Method | True peak at −12 LUFS | at −10 LUFS | at −8 LUFS | 16 times at −8 LUFS | Signal / residual ratio at −8 LUFS |
|---|---|---|---|---|---|
| Limiter | −0.82 dBTP | −0.73 dBTP | −0.29 dBTP | −0.15 dBTP | 17.1 dB |
| Limiter, 4 times | −0.95 dBTP | −0.88 dBTP | −0.88 dBTP | −0.86 dBTP | 16.6 dB |
| Hard clipper | −0.75 dBTP | −0.35 dBTP | +0.10 dBTP | +0.41 dBTP | 31.1 dB |
| Hard clipper, 4 times | −0.48 dBTP | −0.34 dBTP | −0.12 dBTP | −0.14 dBTP | 28.7 dB |
| Soft clipper | −2.42 dBTP | −1.64 dBTP | −1.17 dBTP | −0.81 dBTP | 20.9 dB |
| Soft clipper, 4 times | −2.28 dBTP | −1.44 dBTP | −0.96 dBTP | −0.92 dBTP | 20.6 dB |
Under the defined alignment metric, direct hard clipping left the smallest residual difference: about 57 dB below the processed signal at −12 LUFS, and 31 dB below at −8 LUFS. The direct limiter produced ratios of about 37 and 17 dB. Hard clipping changes only values beyond its threshold; a limiter’s gain change extends around the peak. The comparison also includes filter effects in the oversampled paths. None of these ratios establishes which version sounds more natural.
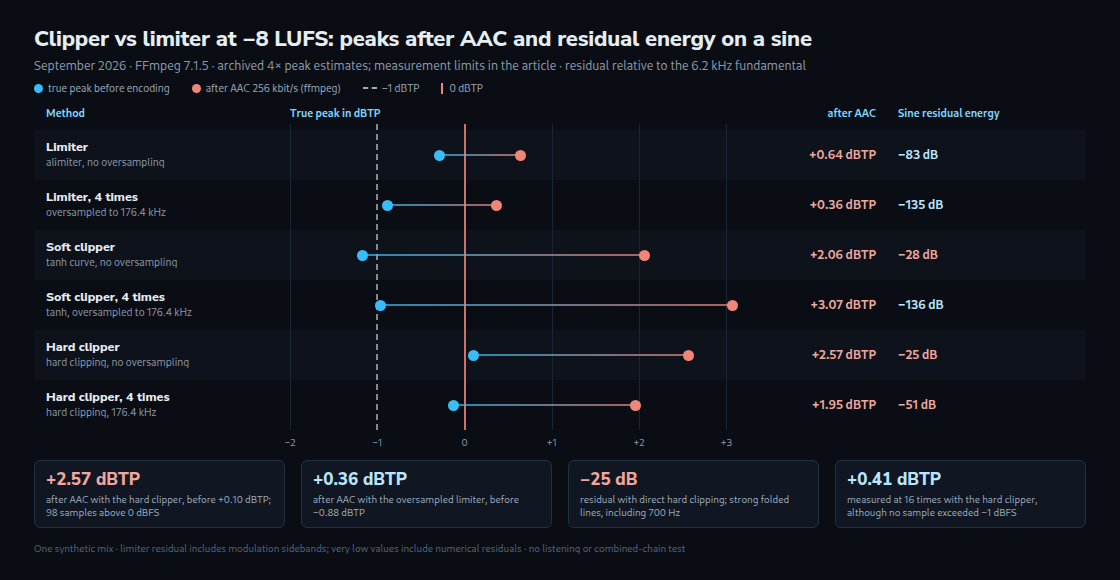
The soft curve changes samples even below its nominal threshold. Before encoding at −8 LUFS, the direct soft clipper had the lowest 4× estimate, −1.17 dBTP; the oversampled soft clipper had the lowest 16× estimate, −0.92 dBTP. The oversampled limiter was therefore not the lowest-peak method before encoding. It did have the lowest AAC result in the next table.
After encoding: large AAC peaks in this mix
| Method at −8 LUFS | True peak before | After AAC 256 | After MP3 320 | After Opus 128 | Samples above 0 dBFS after AAC | AAC, 16× estimate |
|---|---|---|---|---|---|---|
| Limiter | −0.29 dBTP | +0.64 dBTP | −0.21 dBTP | +0.21 dBTP | 2 | +1.01 dBTP |
| Limiter, 4 times | −0.88 dBTP | +0.36 dBTP | −0.52 dBTP | −0.01 dBTP | 3 | +0.45 dBTP |
| Hard clipper | +0.10 dBTP | +2.57 dBTP | +0.27 dBTP | +0.77 dBTP | 98 | +2.77 dBTP |
| Hard clipper, 4 times | −0.12 dBTP | +1.95 dBTP | +0.12 dBTP | +1.05 dBTP | 101 | +1.95 dBTP |
| Soft clipper | −1.17 dBTP | +2.06 dBTP | −0.79 dBTP | +0.19 dBTP | 8 | +2.25 dBTP |
| Soft clipper, 4 times | −0.96 dBTP | +3.07 dBTP | −0.95 dBTP | −0.08 dBTP | 12 | +3.08 dBTP |
All six −8 LUFS AAC versions exceeded zero. The smallest 4× result was +0.36 dBTP for the oversampled limiter; the largest was +3.07 for the oversampled soft clipper. Re-encoding the archived masters during the review reproduced these figures. The 16× comparison confirms the overshoots, but not identical values: for example, the direct limiter changes from +0.64 to +1.01 dBTP.
The sample counts are values above full scale across both channels, not a count of audible clipping events. Floating-point decoding preserves those values. Actual clipping depends on the following processing stage and gain.
At −10 LUFS, all six archived AAC results were also positive. At −12 LUFS, all eighteen results across the three tested codecs stayed negative in the historical 4× calculation. That describes this mix and these settings. It does not prove that every louder master creates a larger rise, or that −12 LUFS is universally safe.
What the results support in practice
Oversampling can reduce unwanted folded components, at the cost of more processing and potentially different filtering or delay. A useful comparison checks the actual plug-in’s oversampling options at equal loudness. The chosen sound and the required peak margin both matter.
A downstream limiter may control peaks from a clipper, but that combined chain was not tested here. A sample limiter also does not guarantee a true-peak ceiling after resampling or encoding. The final exported and decoded file still needs measurement. The related mastering tutorial for FL Studio describes a separate setup; its threshold is not a universal setting for this experiment.
The LUFS and True Peak Meter offers a browser check of an export. Browser decoding and resampling may differ from a mastering plug-in. Peak measurements complement listening; they cannot decide whether distortion, transient changes or a particular character suit the music.
Questions and answers
Why do the unwanted tones appear at 13.1, 11.7 and 0.7 kHz?
Symmetric hard and tanh curves driven by a sine produce odd harmonics. For a 6.2 kHz fundamental, the fifth harmonic is 31.0 kHz and the seventh is 43.4 kHz. At 44.1 kHz sampling, these fold to 44.1 − 31.0 = 13.1 kHz and 44.1 − 43.4 = 0.7 kHz. The ninth harmonic, 55.8 kHz, folds to 55.8 − 44.1 = 11.7 kHz.
With 4× processing, the relevant half-rate boundary is 88.2 kHz. Very high harmonics can still fold: 167.4 kHz becomes 9.0 kHz, and 179.8 kHz becomes 3.4 kHz. Oversampling moves the boundary; it does not make a hard clipper’s harmonic series finite.
Can a lower threshold be calculated from the AAC result?
Only as a rough hypothesis. If an already decoded file peaks at +0.36 dBTP, lowering that file by more than 0.36 dB moves its peak below zero. Lowering a limiter threshold and encoding again is a different operation: limiting, loudness and codec behaviour can all change. The experiment did not measure a threshold that guarantees a negative result after a new encode. Spotify’s recommendation of true peak below −2 dBTP for masters louder than −14 LUFS remains guidance, not a proof for this chain.
Is a clipper followed by a limiter better?
This experiment does not answer that. The six paths each used one clipping or limiting method, with or without external oversampling. A combined chain needs its own level-matched listening comparison and peak measurements before and after encoding. Different plug-ins use different curves, timing and filters.
Sources
- Practical Advice – Physical Audio Signal Processing (Julius O. Smith III)
- Nonlinearities – Physical Modeling Synthesis Update (Julius O. Smith III)
- Fruity Soft Clipper – Effect Plugin
- FFmpeg Filters Documentation
- ITU-R BS.1770: Algorithms to measure audio programme loudness and true-peak audio level
- EBU Tech 3343: Guidelines for Production of Programmes in accordance with R 128
- Spotify for Artists: Loudness normalization
- MDN: Audio decoding and resampling with decodeAudioData
One problem, a clear way through
I want a clean music export
- Understand: Clipper or limiter?
- Try it: Measure loudness and peaks
- Check the loudness and peaks of your export. Measurements help with comparisons; listening and considering your source material still matter.
Related articles