English
 Deutsch
 Polski
Stereo Widening: How Much Width Three Methods Add and What They Cost in Mono, Measured

Management Summary
Stereo widening changes the differences between the left and right channels to give music a more spacious character. Some methods strengthen existing differences; others introduce short delays. When playback combines both channels into mono, parts of the sound can become quieter or cancel out. The comparison explains why a wide mix also needs to retain its important instruments in mono. A single width reading cannot reveal all changes in bass, tone or level.
Contents
A wide stereo mix can become quieter or lose particular frequencies when left and right are combined. A delayed copy of an instrument provides an example: stereo playback can create a sense of space, while the original and copy can partly cancel in mono.
This comparison examines three kinds of processing in FFmpeg: increasing existing channel differences, mixing channels with delayed components, and using the haas filter to create new stereo from the mid signal. Measurements show level and frequency changes. Perceived width was not evaluated in a listening test.
Mid, side and mono explained
This measurement uses M = (L + R) / 2 for mid and S = (L − R) / 2 for side. L and R are the left and right sample values. Identical signals in both channels produce no side. Opposing signals can disappear when added. “Side” therefore means a calculated difference, not simply instruments at the edges of the stereo panorama.
The mono version used here is M: the sum multiplied by one half. Other devices may sum differently or adjust levels. This comparison uses the same calculation for every version.
Measurement setup and actual settings
The original measurement on 21 September 2026 used FFmpeg 7.1.5: 32 seconds of synthetic music at 44.1 kHz and 20 seconds of pink noise with identical channels. Scripts, result files and audio were checked on 25 October. Correlation and mono levels were recalculated for 14 combinations. Three filters reapplied to the music produced the same samples as the archived outputs.
- Side doubled: M stays unchanged and S is multiplied by two. Output becomes L′ = M + 2S and R′ = M − 2S.
- extrastereo: Factors 1.5 and 2.5, both with
c=0. This disabled the clipping at ±1 that is enabled by default. Pure side scaling applies only without subsequent clipping or other nonlinear processing. - stereowiden: delay=20, feedback=0.3, crossfeed=0.3 and drymix=0.8. The filter combines the original, an inverted opposite channel and a delayed opposite channel. The dry component alone does not explain the change.
- haas: Default delays are 2.05 and 2.12 ms. The second variant uses 10 and 10.2 ms. By default, the filter takes M as its source and constructs both output channels from it. The original side component is not retained. This is one implementation, not a test of every method called a Haas effect.
Before the mono comparison, each stereo version received a fixed gain adjustment to match the original’s integrated loudness. This prevents overall loudness differences from dominating the comparison. The analysis then compared mean mono energy level and narrow frequency bands from 25 Hz to 16 kHz. The bands divide each octave into twelve sections; even this averaging can hide narrower dips.
More side energy measures a change
Correlation describes channel similarity: +1 indicates strong agreement for signals with matching polarity, while −1 indicates complete opposition. A value near zero means little linear relationship. The side/mid ratio describes energy in the difference relative to the sum. The “width gained” column here means only the change in that ratio in dB.
| Method | Correlation | Side against mid | Width gained |
|---|---|---|---|
| Original | 0.921 | −13.83 dB | – |
| extrastereo 1.5 | 0.830 | −10.31 dB | 3.52 dB |
| side doubled | 0.716 | −7.81 dB | 6.02 dB |
| stereowiden, default | 0.677 | −7.15 dB | 6.68 dB |
| extrastereo 2.5 | 0.589 | −5.87 dB | 7.96 dB |
| haas, 10 ms | 0.052 | −0.43 dB | 13.40 dB |
| haas, default | 0.037 | −0.31 dB | 13.52 dB |
In this test, haas increased the side ratio most strongly, from −13.83 to −0.31 dB. Correlation fell from 0.921 to 0.037. These figures establish neither a general sound-quality ranking nor a particular mono loss. That requires comparing the mono output.
What remains after combining the channels
“Level matched by” is the gain or attenuation applied beforehand. “Mono sum” is the change in mean energy level compared with the original’s mono version. The deepest dip concerns one analyzed frequency band, not the entire file.
| Method | Level matched by | Mono sum | Deepest dip | Bands below −6 dB |
|---|---|---|---|---|
| extrastereo 1.5 | −0.30 dB | −0.30 dB | even | 0 |
| side doubled | −0.70 dB | −0.70 dB | even | 0 |
| extrastereo 2.5 | −1.10 dB | −1.10 dB | even | 0 |
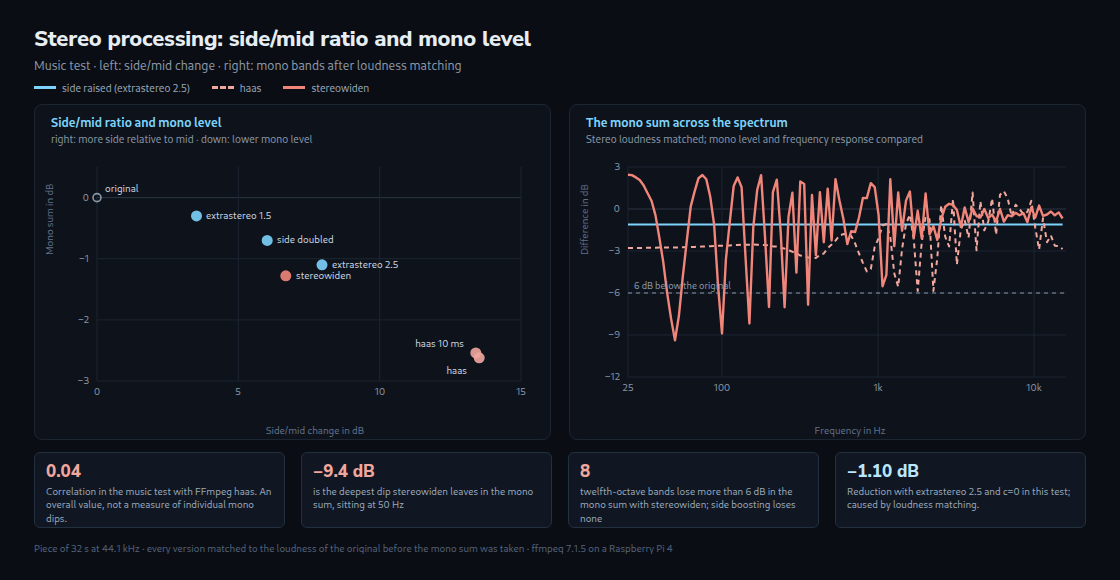
| stereowiden, default | +4.40 dB | −1.28 dB | −9.37 dB at 50 Hz | 8 |
| haas, 10 ms | −2.70 dB | −2.54 dB | −5.88 dB at 1.6 kHz | 0 |
| haas, default | −2.80 dB | −2.62 dB | −5.85 dB at 1.8 kHz | 0 |
Pure side scaling leaves M mathematically unchanged. Only the subsequent loudness adjustment also lowers M. The uniform mono reductions here therefore equal exactly −0.30, −0.70 and −1.10 dB. That describes this linear processing and gain adjustment, not a general guarantee for every stereo plugin.
stereowiden also changes the frequency response of the mono output. Eight analyzed bands lose more than 6 dB; the deepest is at 50 Hz with −9.37 dB. Mixing delayed signals creates a repeated pattern of boosts and dips called comb filtering.
For haas, the overall mono level change is about −2.6 dB. The change is not uniform: individual bands fall almost 6 dB. In the music example, haas has the lower overall correlation but stereowiden has the deeper individual band dip. One correlation figure therefore cannot replace frequency analysis.
Why loudness matching matters
Without adjustment, the stereowiden mono output was 5.68 dB below the original. Its stereo version was also 4.40 dB quieter. Raising the level by 4.40 dB leaves −1.28 dB in the mono energy comparison. Lower stereo loudness results from the entire filter, including opposite-channel components and delay; drymix=0.8 alone does not explain a 4.40 dB reduction.
A check with identical channels
The pink noise is identical on the left and right. S is therefore zero and pure side scaling cannot widen it. Correlation remains 1.0 and the mono level change remains 0.00 dB in the test. Delay filters can create new differences.
With this noise, haas reaches a correlation of 0.137. stereowiden produces six bands with more than 6 dB loss, including −8.77 dB at 50 Hz. A mono kick placed before such a filter is therefore not automatically protected. An unprocessed track must actually bypass the filter; a frequency split also needs checking after recombination.
Practical implications
Pure side scaling retains the calculated mid signal as long as clipping or further processing does not intervene. More side energy can still produce higher peaks. Stereo output, mono output and peak levels therefore need checking together.
Delay can be a deliberate sound effect, including on groups. These measurements do not justify a blanket ban on bass or master-bus delay. The more concrete question is whether important parts of the recording remain sufficiently intact when combined. Short passages and individual frequency regions can differ from whole-track averages.
Wave Candy displays channel relationships as a moving vectorscope pattern. The linked analysis tool provides correlation and mid/side numbers too. Neither a reassuring display nor one file average replaces listening to and checking the mono version.
Questions and answers
Do these numbers apply to Fruity Stereo Enhancer?
No: the measurements used FFmpeg filters. Image-Line describes Stereo Separation as processing existing channel differences, which cannot create stereo from identical channels. Phase Offset delays one channel; Invert reverses one channel’s polarity. These principles explain possible mono effects, but do not provide identical results for other settings or plugins.
What happens when one channel’s polarity is reversed?
With originally identical channels, L + R becomes L − R. The shared content then disappears in the mono sum. With different channels, their difference remains. This is different from a small time delay.
Are correlation and side/mid the same?
With equal channel energy and no relevant DC component, the quantities are related: for the power ratio r = power(S) / power(M), correlation = (1 − r) / (1 + r). A value of −5.87 dB gives r ≈ 0.259 and correlation ≈ 0.589. With unequal channel levels, that ratio alone is insufficient. Even under suitable conditions, the formula does not describe individual frequency dips.
Related articles, tools and sources
- true peak after encoding
- loudness matching with reference tracks
- tool for stereo correlation and mid/side
- Image-Line: Fruity Stereo Enhancer
- Image-Line: Wave Candy
- ffmpeg: Filters Documentation
- ITU-R BS.1770: Algorithms to measure audio programme loudness and true-peak audio level
- FFmpeg 7.1.5: af_haas.c
- FFmpeg 7.1.5: af_stereowiden.c
- FFmpeg 7.1.5: af_extrastereo.c
Related articles