English
 Deutsch
 Polski
GA4 Behavioural Modelling: The Two Eligibility Thresholds and Where Modelled Figures Appear

Management Summary
Behavioural modelling in GA4 estimates some website activity missing when analytics consent is absent. Its purpose is to make selected reports more informative despite measurement gaps, rather than to recover a complete record of every visit. The feature needs enough consenting users and events without consent, along with further quality conditions. The resulting estimates appear only in certain reports and not in the event export. This explains why different views can disagree without one being a simple copy of the other.
Contents
Consent mode does not automatically fill every gap caused by missing analytics consent. GA4 behavioural modelling estimates user and session activity only for eligible properties. The two published volume thresholds are minimum requirements, not an activation guarantee.
Events and users are different quantities
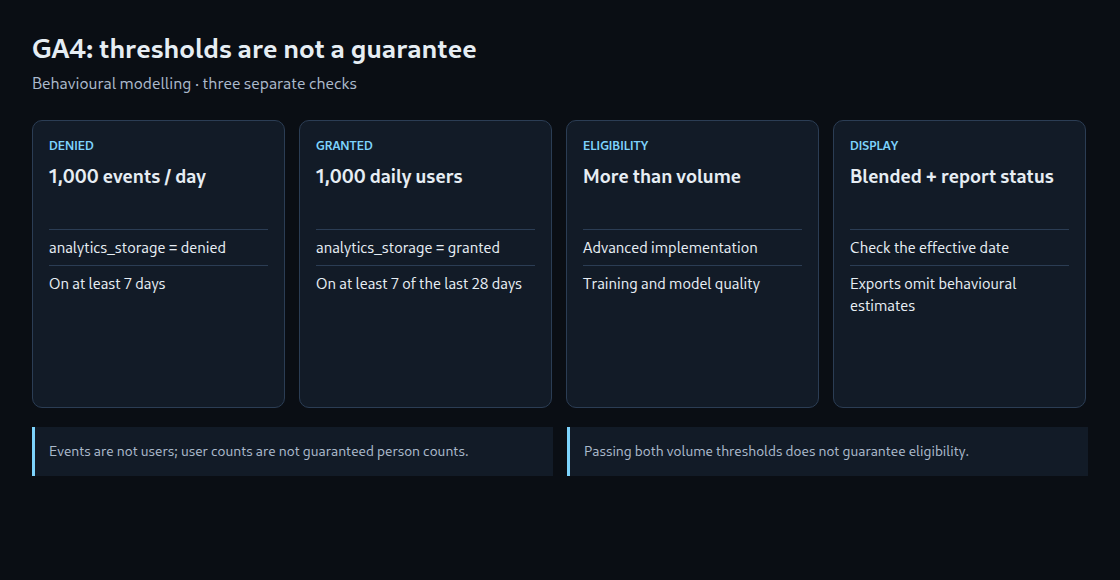
The first threshold is at least 1,000 events per day with analytics_storage='denied' on at least seven days. The second is at least 1,000 daily users sending events with analytics_storage='granted' on at least seven of the previous 28 days. Google’s wording specifies the 28-day window for the second condition; adding that window or a consecutive-day requirement to the first would go beyond the published wording.
A thousand events could come from many visits or repeated activity in a small number of visits. Conversely, an analytics user is not a guaranteed count of one physical person. Neither threshold can be replaced by a total page-view count or a banner acceptance rate.
Collection, eligibility and display
The web implementation must use advanced consent mode across all pages: tags load even without consent, with the appropriate default state established before measurement. Basic mode blocks Google tags when consent is absent and therefore does not provide this denied-event input. Consent mode controls tag behaviour; it is not itself permission to collect data.
Even sufficient volume can leave a property ineligible. Training and additional model-quality criteria also matter. Displaying behavioural estimates requires the Blended reporting identity. Observed and Device-based omit this behavioural modelling. Changing the reporting identity does not change collection or permanently rewrite the underlying data.
Reports need different interpretations
In reports, modelling concerns metrics such as users and sessions rather than simply multiplying event counts. Path and funnel explorations treat first_visit and session_start differently: these events can be modelled there. Listing those explorations as universally unsupported is therefore misleading.
Behavioural estimates are unavailable in audiences, user explorer, cohort and user lifetime explorations, sequence segments, retention reports, predictive metrics and BigQuery exports. That does not establish that every difference between a report and an export is caused by modelling. Date ranges, metric definitions and the query itself still need comparison. Missing estimates also do not prove that no cookieless events were collected.
Status is part of the measurement
The data-quality icon provides modelling status and the effective date. Google’s documentation also describes interface banners and communication about changes with a large data impact. If eligibility is lost and later regained, estimates resume only from the new eligibility date; a filled historical gap is not promised.
A useful review records the property, date range, reporting identity, status message and report type together. Local counts can reveal insufficient volume or broken collection, but cannot certify Google’s internal eligibility decision.
Questions and answers
What does a high refusal rate imply?
At a fixed total and otherwise identical conditions, a higher refusal share leaves fewer consenting users. It does not identify which threshold is the bottleneck. For example, 1,500 consenting users and only 500 denied events still miss the event requirement. Reversing those quantities misses the user requirement.
Is 1,000 / (1 − q) a useful calculation?
Only as a simplified planning example. If q is a refusal share for the same daily user population, every user falls into exactly one consent category and the counts use compatible definitions, 60% implies 2,500 total users and 80% implies 5,000 to reach 1,000 consenting users. The calculation says nothing about denied-event volume or model quality. A rate per banner impression is a different denominator.
Nor does this formula estimate missing purchases. In an illustrative population with 1,000 consenting and 1,000 non-consenting users, 100 observed purchases could coexist with 20 or 200 purchases in the other group. Equal group sizes do not establish equal buying behaviour.
Related articles