English
 Deutsch
 Polski
Converting 48 kHz to 44.1 kHz: Aliasing, High-Frequency Loss and Peaks of swr and soxr, Measured

Management Summary
Sample-rate conversion changes how many sound values an audio file stores per second while preserving the music’s speed and pitch. It is needed when a recording must meet a different delivery format. The comparison shows that conversion methods differ in preserving high tones and suppressing unwanted tones created by the process. Loud peaks can also increase even when overall loudness stays the same. A suitable method and enough room below the maximum level help avoid distortion in the final file.
Contents
- What was measured and how
- High tones: How much does the level fall?
- Excessive high tones: What survives as an alias?
- Peaks: New samples can exceed 0 dBFS
- Pre-ringing and processing time
- A reproducible conversion
- FL Studio and the limits of this comparison
- Questions and answers
- Related articles, tools and sources
A recording at 48 kHz contains 48,000 samples per second in each channel. For a 44.1 kHz file, a resampler calculates 44,100 new values. The music should retain its speed and pitch. Changing only the number in the file header cannot achieve that.
Before lowering the sample rate, excessive high frequencies need sufficient attenuation. At 44.1 kHz, the upper representable frequency boundary is 22.05 kHz, called the Nyquist frequency. A 22.5 kHz tone that survives the filter appears incorrectly at 21.6 kHz after conversion. This falsely located tone is an alias.
The comparison examines five FFmpeg 7.1.5 settings. The tables come from measurements on 17 September 2026. The original scripts, logs and test files were reviewed on 25 October; all 70 tone measurements were recalculated and matched. Processing times and master peaks remain results from the original run.
What was measured and how
- Converters: FFmpeg defaults to swr. The test used filter lengths 16, 32 and 128. The soxr alternative used precision 20 and 28. That requires an FFmpeg build with libsoxr support.
- Output: 44.1 kHz, 32-bit floating point. This format can store values above 0 dBFS. Filter cutoff settings remained unchanged: 0.97 for swr and 0.91 for soxr. These options describe different points on the filter curve, so the numbers are not directly equivalent.
- Tones: One second per sine tone at approximately −6 dBFS. Analysis covered the middle half second. A least-squares fit determines the component at the frequency being examined. Ten tones from 1 to 22 kHz test level changes; four tones above 22.05 kHz test alias components.
- Impulse: One short impulse reveals small oscillations before and after the main value. The reported durations extend to the outermost crossing of the stated threshold relative to the impulse peak.
- Test music: Two synthetic 32-second stereo masters: one limited to −9 LUFS and one hard-clipped at −1 dBFS, reaching −8 LUFS. LUFS describes measured loudness. The limiter file was adjusted to approximately −1 dBTP with the four-times measurement; the 16-times cross-check gives a different value.
- Processing time: The shortest of three runs on a Raspberry Pi 4, including file access. This is not a general speed guarantee.
The repeated check also confirms that -ar 44100 produced the same samples as default swr when using the same floating-point output format. The historical check without ARM NEON optimization found a maximum difference of −131 dB relative to the test tone for swr32 and no difference for soxr28.
High tones: How much does the level fall?
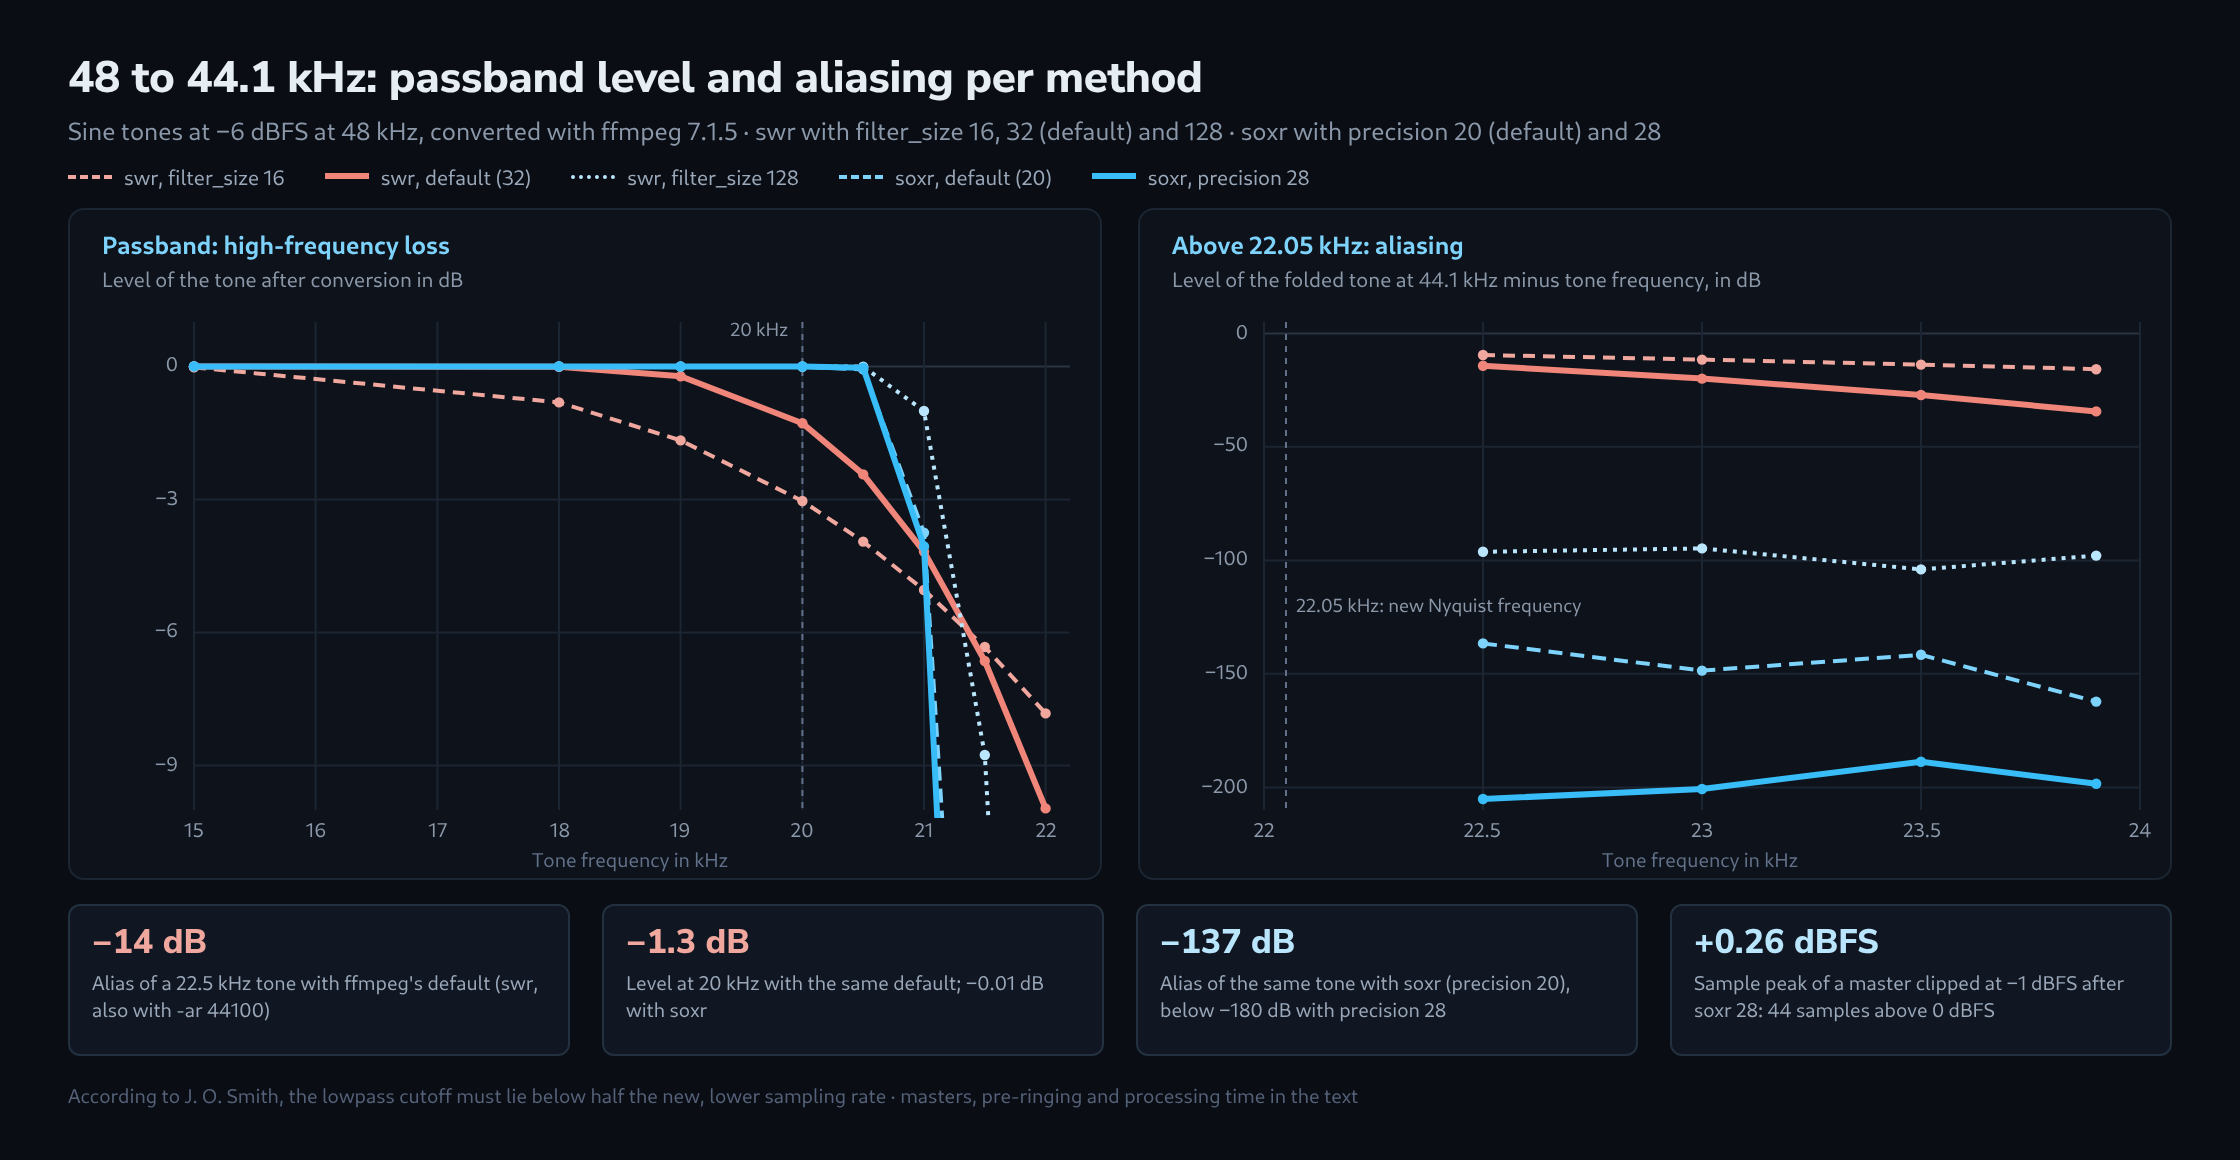
The passband is the frequency range a filter should preserve as closely as possible. Here, 0 dB means the same tone level before and after conversion. Negative values indicate attenuation, not the file’s absolute level.
| Method | 18 kHz | 19 kHz | 20 kHz | 20.5 kHz | 21 kHz |
|---|---|---|---|---|---|
| swr, filter_size 16 | −0.81 dB | −1.67 dB | −3.03 dB | −3.95 dB | −5.04 dB |
| swr, default (filter_size 32) | −0.01 dB | −0.22 dB | −1.28 dB | −2.43 dB | −4.18 dB |
| swr, filter_size 128 | 0.00 dB | 0.00 dB | 0.00 dB | 0.00 dB | −1.01 dB |
| soxr, default (precision 20) | 0.00 dB | 0.00 dB | −0.01 dB | −0.07 dB | −3.75 dB |
| soxr, precision 28 | 0.00 dB | 0.00 dB | 0.00 dB | −0.03 dB | −4.06 dB |
At 20 kHz, default swr attenuated the test tone by 1.28 dB. With filter_size 16, the loss was 3.03 dB. swr128 and both soxr settings stayed within 0.01 dB at the measured points up to 20 kHz. At 20.5 kHz, the largest deviation among these three methods was about 0.07 dB. The table establishes individual measurements, not exhaustive coverage of every frequency.
Excessive high tones: What survives as an alias?
The following values compare the falsely located output tone with the original input tone. −100 dB means a tone component 100 dB lower. Each measurement concerns the stated alias frequency, not all noise in the output file.
| Method | Tone 22.5 kHz, alias at 21.6 kHz | Tone 23 kHz, alias at 21.1 kHz | Tone 23.5 kHz, alias at 20.6 kHz | Tone 23.9 kHz, alias at 20.2 kHz |
|---|---|---|---|---|
| swr, filter_size 16 | −9.5 dB | −11.5 dB | −13.8 dB | −15.8 dB |
| swr, default (filter_size 32) | −14.3 dB | −19.9 dB | −27.1 dB | −34.4 dB |
| swr, filter_size 128 | −96.2 dB | −94.7 dB | −104.0 dB | −97.9 dB |
| soxr, default (precision 20) | −136.6 dB | −148.6 dB | −141.6 dB | −162.2 dB |
| soxr, precision 28 | below −180 dB | below −180 dB | below −180 dB | below −180 dB |
For the 22.5 kHz test tone, swr32 achieved only 14.3 dB attenuation. At the four test frequencies, swr128 achieved about 95 to 104 dB and soxr20 about 137 to 162 dB. The fitted tone components for soxr28 were below −180 dB. This establishes neither a −180 dB overall noise floor nor guaranteed attenuation at every frequency just above 22.05 kHz.
Peaks: New samples can exceed 0 dBFS
Sample peak is the largest absolute value of the stored samples: negative peaks count as well. True peak also estimates peaks between those values by calculating intermediate points. Four-times and 16-times oversampling use different numbers of points; the filter also affects the result. The 16-times soxr cross-check is not a second identical BS.1770 measurement.
| Master | True peak 4 times | True peak 16 times | Sample peak | Samples above 0 dBFS |
|---|---|---|---|---|
| Limiter, −9 LUFS, −1 dBTP: Master at 48 kHz | −1.05 dBTP | −0.79 dBTP | −2.31 dBFS | 0 |
| Limiter: swr, filter_size 16 | −1.16 dBTP | −1.07 dBTP | −1.53 dBFS | 0 |
| Limiter: swr, default (filter_size 32) | −1.03 dBTP | −0.96 dBTP | −1.44 dBFS | 0 |
| Limiter: swr, filter_size 128 | −1.04 dBTP | −0.98 dBTP | −1.35 dBFS | 0 |
| Limiter: soxr, default (precision 20) | −1.05 dBTP | −0.95 dBTP | −1.40 dBFS | 0 |
| Limiter: soxr, precision 28 | −1.05 dBTP | −0.95 dBTP | −1.41 dBFS | 0 |
| Hard clipping at −1 dBFS, −8 LUFS: Master at 48 kHz | +0.38 dBTP | +0.72 dBTP | −1.00 dBFS | 0 |
| Hard clipping at −1 dBFS: swr, filter_size 16 | +0.28 dBTP | +0.38 dBTP | +0.01 dBFS | 2 |
| Hard clipping at −1 dBFS: swr, default (filter_size 32) | +0.41 dBTP | +0.54 dBTP | +0.18 dBFS | 18 |
| Hard clipping at −1 dBFS: swr, filter_size 128 | +0.47 dBTP | +0.64 dBTP | +0.27 dBFS | 41 |
| Hard clipping at −1 dBFS: soxr, default (precision 20) | +0.45 dBTP | +0.64 dBTP | +0.26 dBFS | 42 |
| Hard clipping at −1 dBFS: soxr, precision 28 | +0.44 dBTP | +0.64 dBTP | +0.26 dBFS | 44 |
Loudness remained unchanged at 0.1 LU resolution. The four-times peak estimate changed by at most 0.11 dB; the 16-times cross-check decreased by 0.08 to 0.34 dB. Nevertheless, the limiter master’s highest stored value rose from −2.31 to as much as −1.35 dBFS.
The hard-clipped master originally contained no samples above −1 dBFS. After conversion, between 2 and 44 channel samples exceeded 0 dBFS, depending on the method. Saving such values as 16-bit or 24-bit integers without first lowering the level clips them. A harmless-looking source sample peak therefore does not prevent clipping after conversion.
Pre-ringing and processing time
Pre-ringing means small oscillations before the main impulse. The tested filters produced equally long oscillations before and after it. The −60 dB and −100 dB thresholds are relative to the impulse peak.
| Method | Processing time for 32 s of stereo | faster than real time | Pre-ringing down to −60 dB | down to −100 dB |
|---|---|---|---|---|
| swr, filter_size 16 | 0.50 s | 64 times | 0.14 ms | 0.18 ms |
| swr, default (filter_size 32) | 0.55 s | 58 times | 0.27 ms | 0.36 ms |
| swr, filter_size 128 | 0.81 s | 39 times | 0.68 ms | 1.41 ms |
| soxr, default (precision 20) | 0.70 s | 46 times | 0.98 ms | 1.93 ms |
| soxr, precision 28 | 0.79 s | 40 times | 1.32 ms | 2.27 ms |
At the −60 dB threshold, durations ranged from 0.14 to 1.32 ms, almost a tenfold difference. The absolute durations are short, but no listening test was performed. These figures therefore do not establish audible equivalence.
The historical conversion of 32 seconds of stereo took 0.50 to 0.81 seconds. soxr28 took about 0.10 seconds longer than soxr20. The figures include process startup and file reading and writing, and describe that computer and run.
A reproducible conversion
This example creates a new 44.1 kHz floating-point file from a 48 kHz WAV. -n prevents overwriting an existing output. Floating point initially preserves possible overloads for subsequent inspection; it does not automatically make the file safe for playback or release.
ffmpeg -n -i input-48k.wav -af aresample=44100:resampler=soxr -c:a pcm_f32le output-44100-float.wavConversion is followed by sample-peak and true-peak checks, and level reduction or suitable limiting if necessary. The final exported file needs checking too. A source true-peak value alone does not guarantee an upper bound after every filtering and export step.
Any required reduction to 16 bits with dither comes last. Dither is very quiet noise that avoids systematic rounding distortion when saving at lower resolution. Otherwise, a signal already rounded to 16 bits needs rounding again after sample-rate conversion.
FL Studio and the limits of this comparison
According to the manual, the FL Studio export sample rate is set in Audio Settings. The Resampling selector in the export window instead controls interpolation for Sampler and Audio Clip channels, for example during pitch changes. The FFmpeg figures measured here do not describe FL Studio’s filters.
The synthetic test music contains hi-hats with high frequencies extending to the 24 kHz input boundary. In the original test, measured energy above 20 kHz was about 27 to 29 dB below total energy. Many real recordings contain less there. Whether the aliases between 20.2 and 21.6 kHz are audible depends on the music, hearing and playback; that was not tested.
Questions and answers
Why did longer filters produce more values above 0 dBFS here?
The new sample sequence hits different positions in the filtered waveform. The hard-clipped master already had peaks between samples. Filters with less high-frequency loss smoothed these peaks less in this test. This explains this master’s results without assigning or removing general responsibility for overloads to any resampler. The finished file needs checking.
Does a lower cutoff help?
A lower cutoff shifts the transition towards lower frequencies. Unwanted high-frequency components can then be attenuated more strongly, but wanted high frequencies can also be lost. A longer filter can narrow the transition. These tables compare fixed default cutoffs; the data contain no separate cutoff measurement series.
Does stronger alias attenuation prove better sound?
The measurements establish smaller unwanted tone components at the tested frequencies. Audible improvement was not examined. Processing time, frequency response and pre-ringing are different properties and need separate consideration.
Related articles, tools and sources
- True Peak After Encoding
- hard-clipped master
- LUFS and True Peak Meter
- Dither When Exporting to 16-Bit
- mastering tutorial for FL Studio
- FFmpeg Resampler Documentation
- ffmpeg Documentation
- Implementation – Digital Audio Resampling Home Page (Julius O. Smith III)
- Theory of Ideal Bandlimited Interpolation – Digital Audio Resampling Home Page (Julius O. Smith III)
- Exporting Audio & MIDI – FL Studio Online Manual
- ITU-R BS.1770: Algorithms to measure audio programme loudness and true-peak audio level
- FFmpeg 7.1.5: resampler options
Related articles