English
 Deutsch
 Polski
Prometheus on a Raspberry Pi: How Labels Multiply Time Series and How to Find the Offender

Management Summary
Prometheus collects measurements over time to show how computers and services are operating. On a small Raspberry Pi, the level of detail can determine whether monitoring remains manageable or consumes too much memory. Labels split readings into separate histories, so large numbers of changing identifiers can create disproportionate work. Grouping information meaningfully at the source keeps monitoring useful while limiting overhead. Simply deleting labels is not equivalent to combining the measurements correctly.
Jump to the interactive example ↓
Contents
The number of exporters alone is insufficient for sizing a Raspberry Pi running Prometheus. Time-series count, scrape frequency, queries and retention all matter. Each time series is identified by its metric name and the complete combination of label values.
The number of distinct combinations is called cardinality. The product of the label value counts is an upper bound, not an automatically reached total: some combinations may never occur. Adding a label with one fixed value does not multiply the count. A label with many changing values can nevertheless impose substantial costs.
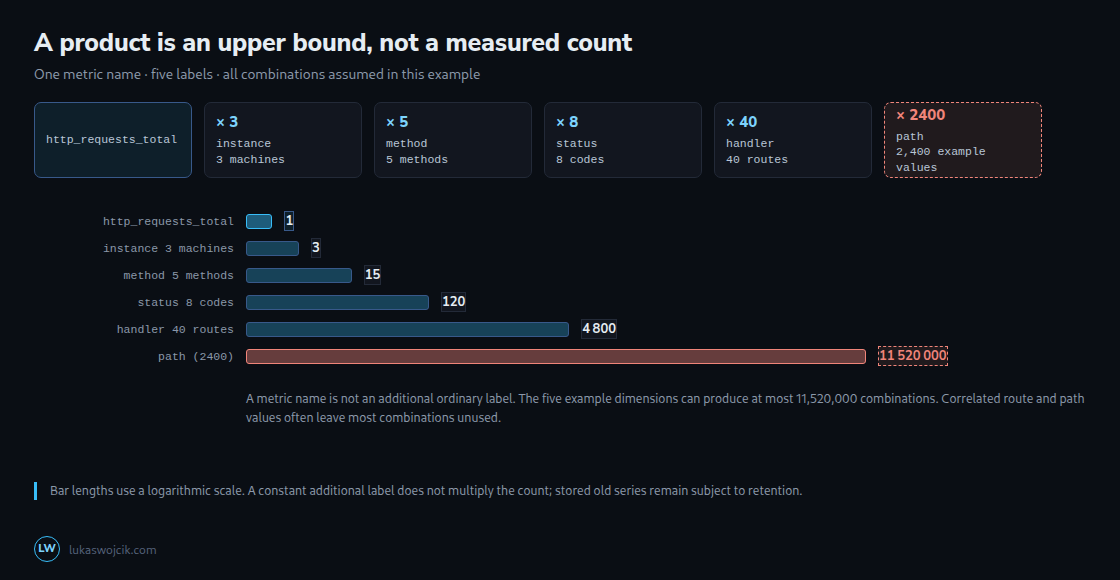
Value counts and turnover need separate attention
A label needs a controlled value set and a purpose. For method and status, actual counts depend on the application and instrumentation. HTTP specifies neither exactly five methods nor exactly twelve status values. Unknown methods can, for example, map to a common fallback value.
Raw paths such as /wp-admin, /.env or /product/12345 can create additional series if instrumentation copies every path into a label. Another request with the same complete label combination creates no additional series. Stored data are also subject to retention rather than remaining forever.
| Label | Typical source of values | Cardinality control |
|---|---|---|
| job / instance | Targets and configuration | Inventory and target count |
| method / status | Application and protocol | Allowed values and fallback |
| handler / route | Route templates | Fixed route set; unknown fallback |
| path (raw) | Request paths | Normalization at the source |
| user_id / email | Individual identifiers | Omission from aggregate metrics |
| container_id / pod | Runtime instances | Current count and turnover |
Churn means series appearing and disappearing, for example as pod identifiers change. If ten old series disappear and ten new series appear, the total stays the same despite twenty changes. A constant number of simultaneously present series can hide high churn. Old series remain relevant in the affected blocks during retention; with a stable turnover rate and bounded retention, the total does not have to keep growing every week.
Assessing resources without a fixed per-series allowance
Many series consume memory, CPU, storage and network capacity. Current series data and indexes, processing the write-ahead log (WAL) used for recovery, and large queries all contribute. A fixed kilobyte allowance per series is not a reliable capacity guarantee: label sizes, samples, versions and query loads vary. RAM, CPU or storage can become the first constraint on a Pi.
Memory exhaustion can cause an out-of-memory (OOM) termination and a restart loop. This is a possible failure sequence, not a diagnosis established by a broken dashboard. Process memory, host headroom, restarts, logs and changes in series count need examination together.
Targeted queries for unusual series counts
The following PromQL examples initially limit the investigation to the example job app. An unrestricted scan across all metrics can add load to an already struggling Pi. The second query counts only present, nonempty path values; with no matching series, this PromQL expression returns no result rather than an automatically supplied zero.
topk(10, count by (__name__)({job="app", __name__=~".+"}))

count(count by (path) (http_requests_total{job="app", path!=""}))

prometheus_tsdb_head_series
delta(prometheus_tsdb_head_series[1h])
The head metrics require Prometheus self-scraping; an empty result can also mean that these metrics are not being collected.
The first query identifies metric names with many series in the current query state. The second examines a label already selected for investigation; it does not automatically discover the offending label. A gauge records a current value that can rise or fall. The head series gauge includes series in the current TSDB head, the area holding recent measurements, and can differ from the series still available in an instant query. delta describes the net change of a gauge extrapolated across one hour, not the number of newly created series.
A rising total can reflect legitimate growth; high churn can occur with a stable total. As a complement, /api/v1/status/tsdb?limit=10 provides rankings by metric name and label values alongside head statistics. These diagnostics also have a cost. Comparison with a known baseline and exporter or deployment changes makes the results useful.
Removing a label does not aggregate values
labeldrop removes label names but does not add values. For example, the counters requests_total{path="/a"} 10 and requests_total{path="/b"} 20 have the same identity after removing path. This does not reliably produce the correct total counter of 30. Collisions can cause samples to be rejected. Label removal is suitable only when the remaining series are still uniquely identified.
A clearly scoped immediate measure is to exclude an expensive metric that is demonstrably dispensable from ingestion altogether. The following example drops every http_requests_total series solely in job app. Those samples will also be unavailable to dashboards and alerts; the metric name is an example requiring adaptation.
scrape_configs:
  - job_name: 'app'
    static_configs:
      - targets: ['app:9100']
    metric_relabel_configs:
      - source_labels: [__name__]
        regex: 'http_requests_total'
        action: drop
A durable solution often belongs at the source: the exporter counts directly by normalized route template, such as /product/:id, with a fixed fallback for unknown routes. Merely relabeling already separate counters to the same identity would create another collision. A PromQL sum or recording rule can simplify analysis but does not prevent prior ingestion of the raw series. Before adoption, promtool check config prometheus.yml checks the configuration; valid YAML alone does not establish that a filter is appropriate.
A budget for new labels
Each label needs documented expectations for value count, turnover, possible combinations and usefulness. A configuration file does not guarantee low cardinality; a finite set can still be too large. Conversely, high cardinality does not automatically imply personal information: random container identifiers pose a different issue from email addresses.
Direct personal identifiers are usually unnecessary for aggregate operational metrics and increase both cardinality and the volume of sensitive information. Omitting these labels reduces those risks but does not replace examination of other potentially personal measurement data.
Questions and answers
Does shorter retention help with memory exhaustion?
Shorter retention primarily limits older data blocks. The current head and expensive queries still require resources. Prometheus initially writes blocks typically spanning two hours; the head normally covers a few hours rather than the full retention period. Compaction, restarts and operating conditions affect the exact span. After a filter changes, old series disappear neither immediately from the head nor retroactively from stored blocks.
Which limits reduce the risk of failure?
Several safeguards complement controlled instrumentation, without guaranteeing uninterrupted operation:
sample_limitlimits accepted samples per scrape after metric relabeling. Exceeding the limit fails the entire scrape;upbecomes zero for the affected target. Normal values ofscrape_samples_post_metric_relabelingplus justified headroom provide a basis for the limit. This does not cap the total stock of changing series across multiple scrapes.- Alerts on series count and its development help alongside memory, restart and scrape-error metrics. A growth alert alone detects neither every instance of churn nor every short load spike.
- An effective hard container memory limit caps consumption within the relevant cgroup; an out-of-memory (OOM) termination there can stop Prometheus. Global memory pressure from other processes remains possible. With Docker, actual kernel/cgroup support, effective limits and swap settings need verification, for example through
docker infoand the container configuration.
Learn by trying
One more label. How many more time series?
Change the number of label values. Then add user_id and watch the multiplier.
- Possible time series
- Samples per day
Upper bound for one simple metric if all combinations occur. Bars use a logarithmic scale. Fewer observed combinations mean fewer series. Histogram buckets and other metrics are excluded; not a RAM forecast.
This module runs in your browser and does not send or store your input.
Learn by trying
One minute: can you spot the mistake?
A metric has 200 combinations. A new label has 5,000 values occurring with every existing combination. What is the upper bound?
Combinations multiply: 200 × 5,000. Only observed combinations actually exist. Unbounded IDs as labels can keep expanding that space.
Related articles