Why a Metric Grows After a Blend
Contents
A blend is presented as a way of putting two sources side by side, and that is what it looks like in the editor: pick a left table, pick a right one, name a field they share. What it actually does is a join, and a join does not add columns to rows – it produces one row for every pair that matches.
When both sides hold exactly one row per key, the two descriptions coincide and nothing surprising happens. When the right side holds three, every row on the left appears three times, and every metric on the left is counted three times with it. The report shows no warning, because nothing went wrong.
What a Join Actually Does
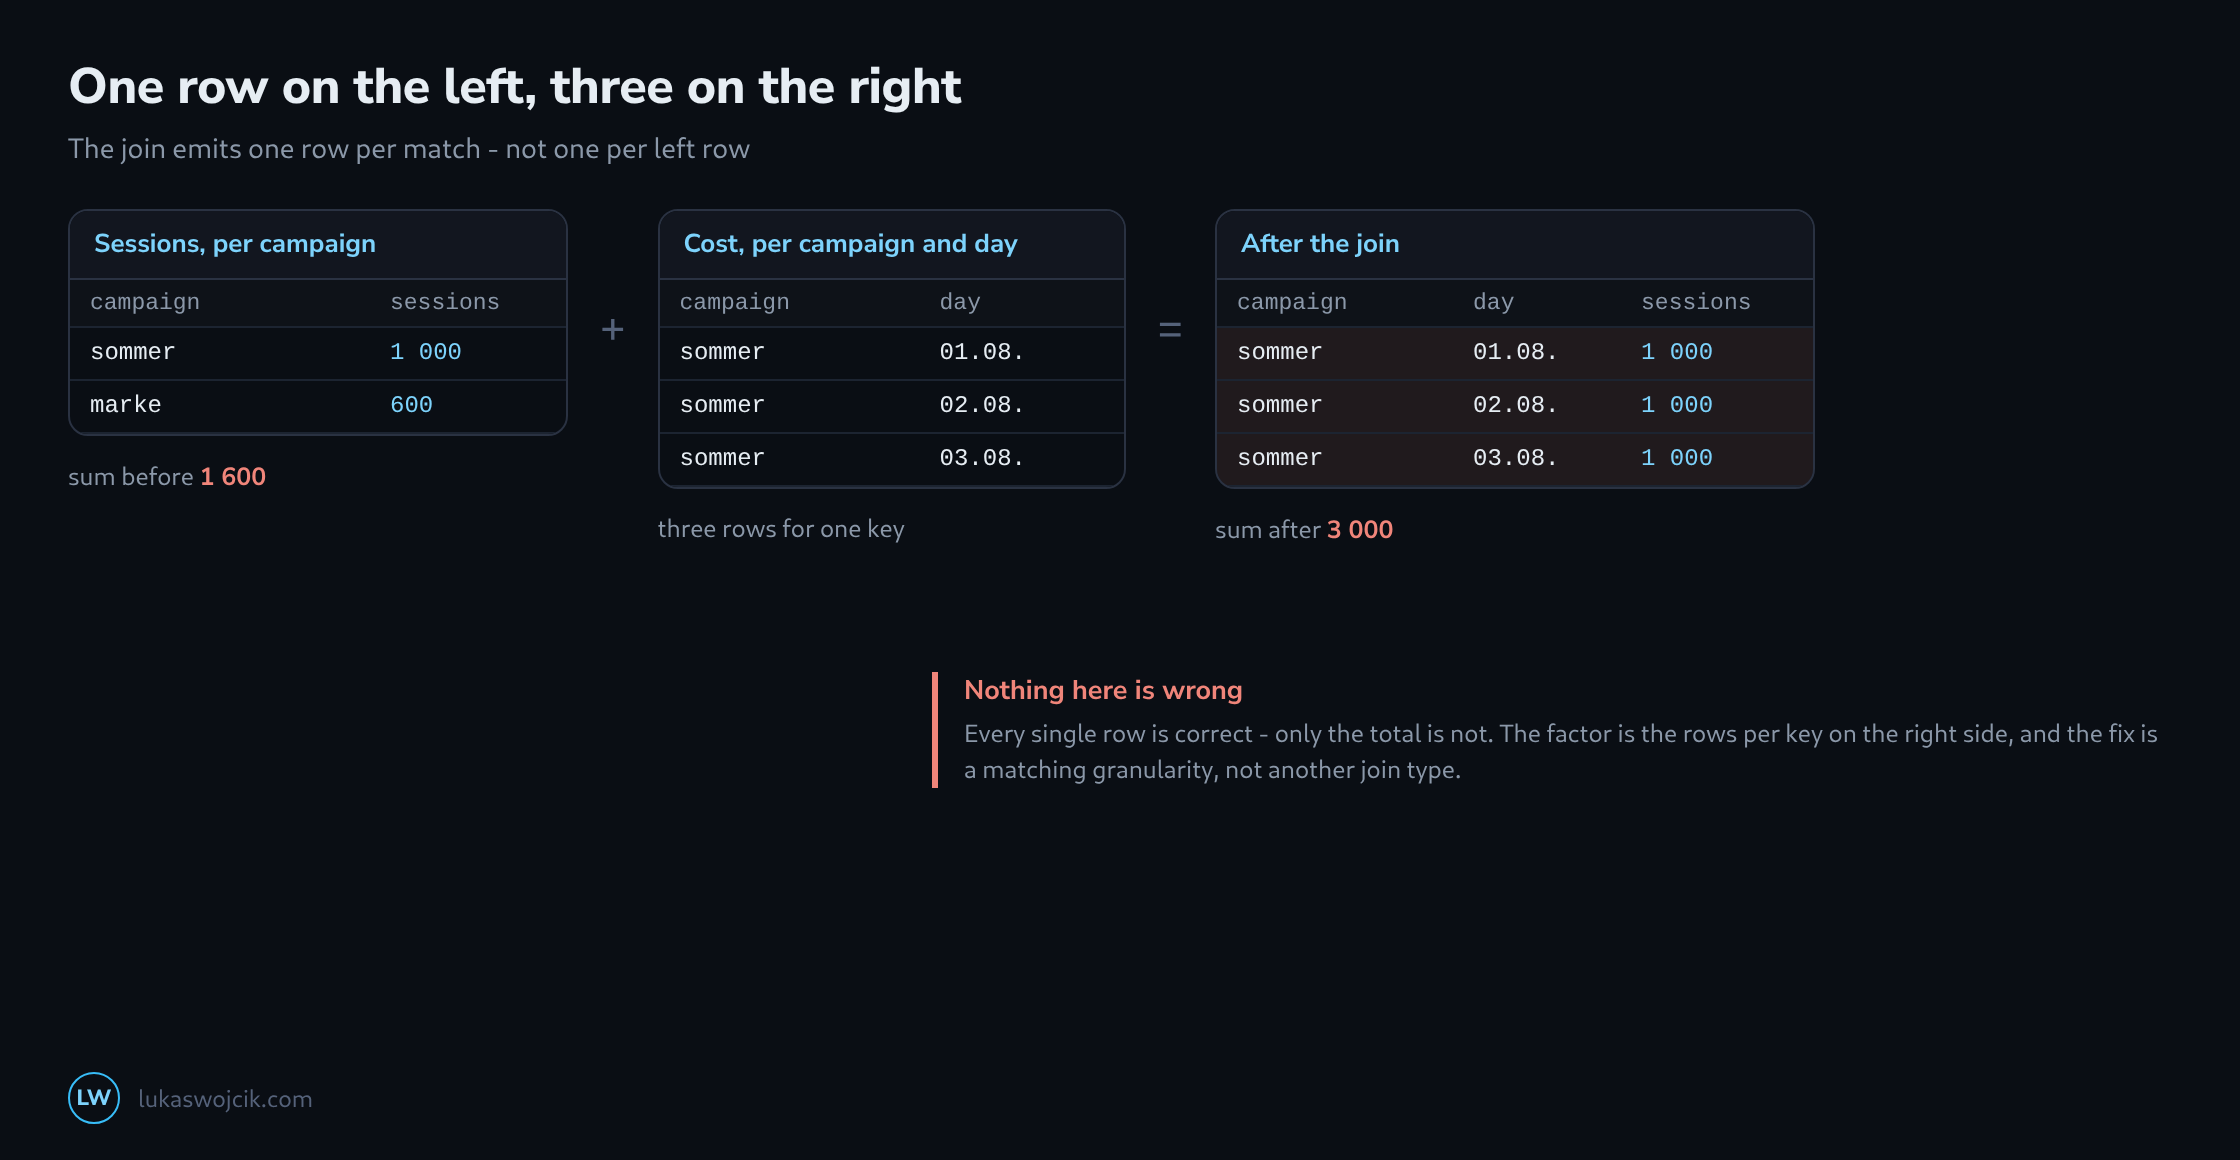
For every row on the left, the join looks for rows on the right that carry the same key. It emits one output row per match – not one per left row. That single sentence explains every inflated figure a blend has ever produced.
The direction matters too. A left join keeps rows without a partner and fills their right-hand columns with nulls, which shows up as empty bars rather than missing ones. An inner join drops them silently, and that is the version that quietly shortens a report: the campaigns without cost data simply stop existing.
The Arithmetic That Goes First
Two numbers per side are enough to predict the outcome: how many rows there are, and how many distinct values the join key has. Their quotient is the rows per key, and the rows per key on the right side is the factor by which the left side’s metrics are multiplied.
| Case | Rows per key | Result |
|---|---|---|
| Campaign to campaign | 1 to 1 | Columns are added, nothing is multiplied. The intended case. |
| Campaign to campaign and day | 1 to 30 | Every session count appears thirty times. The most common accident. |
| Campaign and day to campaign and ad | 30 to 12 | The product of both, and a table nobody can read. |
The middle row is worth dwelling on because it looks harmless in the editor. Sessions are aggregated per campaign, cost is exported per campaign and day, and the shared field is the campaign. Both tables are correct; joined on that key alone, the session count is multiplied by the number of days in the range.
The fix is not a different join type but a matching granularity: either the cost side is aggregated to the campaign first, or the date joins as a second key so that each side stands at the same level of detail.
Why the Sum Explodes and the Average Does Not
Sums grow with the number of rows; ratios computed inside the blend often do not, because numerator and denominator are multiplied together. A cost-per-session that stays plausible while the session count has tripled is therefore not a sign that everything is fine – it is the reason the inflation is discovered three weeks later, in the row where someone finally looks at an absolute number.
Metrics from the right table cannot be re-aggregated afterwards either. Whatever arrives multiplied stays multiplied for every chart built on that blend, which is why the check belongs before the first chart rather than after the tenth.
The Key Is Rarely Clean
The second failure mode is the opposite of the first: nothing matches. A key of google / cpc on one side and google/cpc on the other differs by two spaces, and a join has no opinion about spaces. Capitalisation, trailing blanks from a spreadsheet export and a campaign name that carries a suffix in one system are the usual three.
A calculated field on both sides settles it before the join runs – lowercase, trimmed, and where several fields form the key, concatenated with a separator that cannot appear inside the values. A match rate that jumps from thirty percent to ninety-five after that change is a normal result, not a suspicious one.
The Check That Costs a Minute
One number, twice: the total of a metric on the source alone, and the same total inside the blend. If it grew, the join multiplied rows, and the factor is the quotient of the two. If it shrank, an inner join dropped rows without a partner. If it stayed the same, the blend is doing what it looked like it was doing.
That comparison takes a scorecard and a minute, and it is the only step that turns a blend from something that looks right into something that is. Everything else in this article is an explanation of what the two numbers mean when they differ.
Related articles