GA4 Alerts on Small Numbers: Threshold, Interval and Statistical Noise

Contents
An alert on cart events is meant to report when something in the shop breaks. For it to do that, the drop has to be clearly larger than what the numbers do on their own anyway. Only then is the difference significant – large enough not to be mere chance. Where that line gets drawn is the threshold of the alert.
This is exactly where most alerts on quiet shops fail. They are necessarily set so that nothing short of a halving trips them, and so they sit silently through a checkout that is broken for a third of customers. On small numbers, a third is still inside the normal swing.
Which of the two situations a given shop is in is not a matter of judgement. It hangs on a single number: how many events land in one interval, that is, in the time window the alert counts over.
Why Small Numbers Swing More
Counted things always vary, even when nothing has changed. Ten coin tosses rarely give exactly five heads; seven or three come up all the time. A thousand tosses land close to half almost every time. The variation does not go away, then, it simply weighs less and less against the total.
For an alert it is exactly that ratio which decides. At twenty-five events the usual swing is about five, a fifth of the total. At two thousand five hundred events it is about fifty: ten times as much in absolute terms, but only a fiftieth in relative terms. Large numbers are calm, small ones are restless.
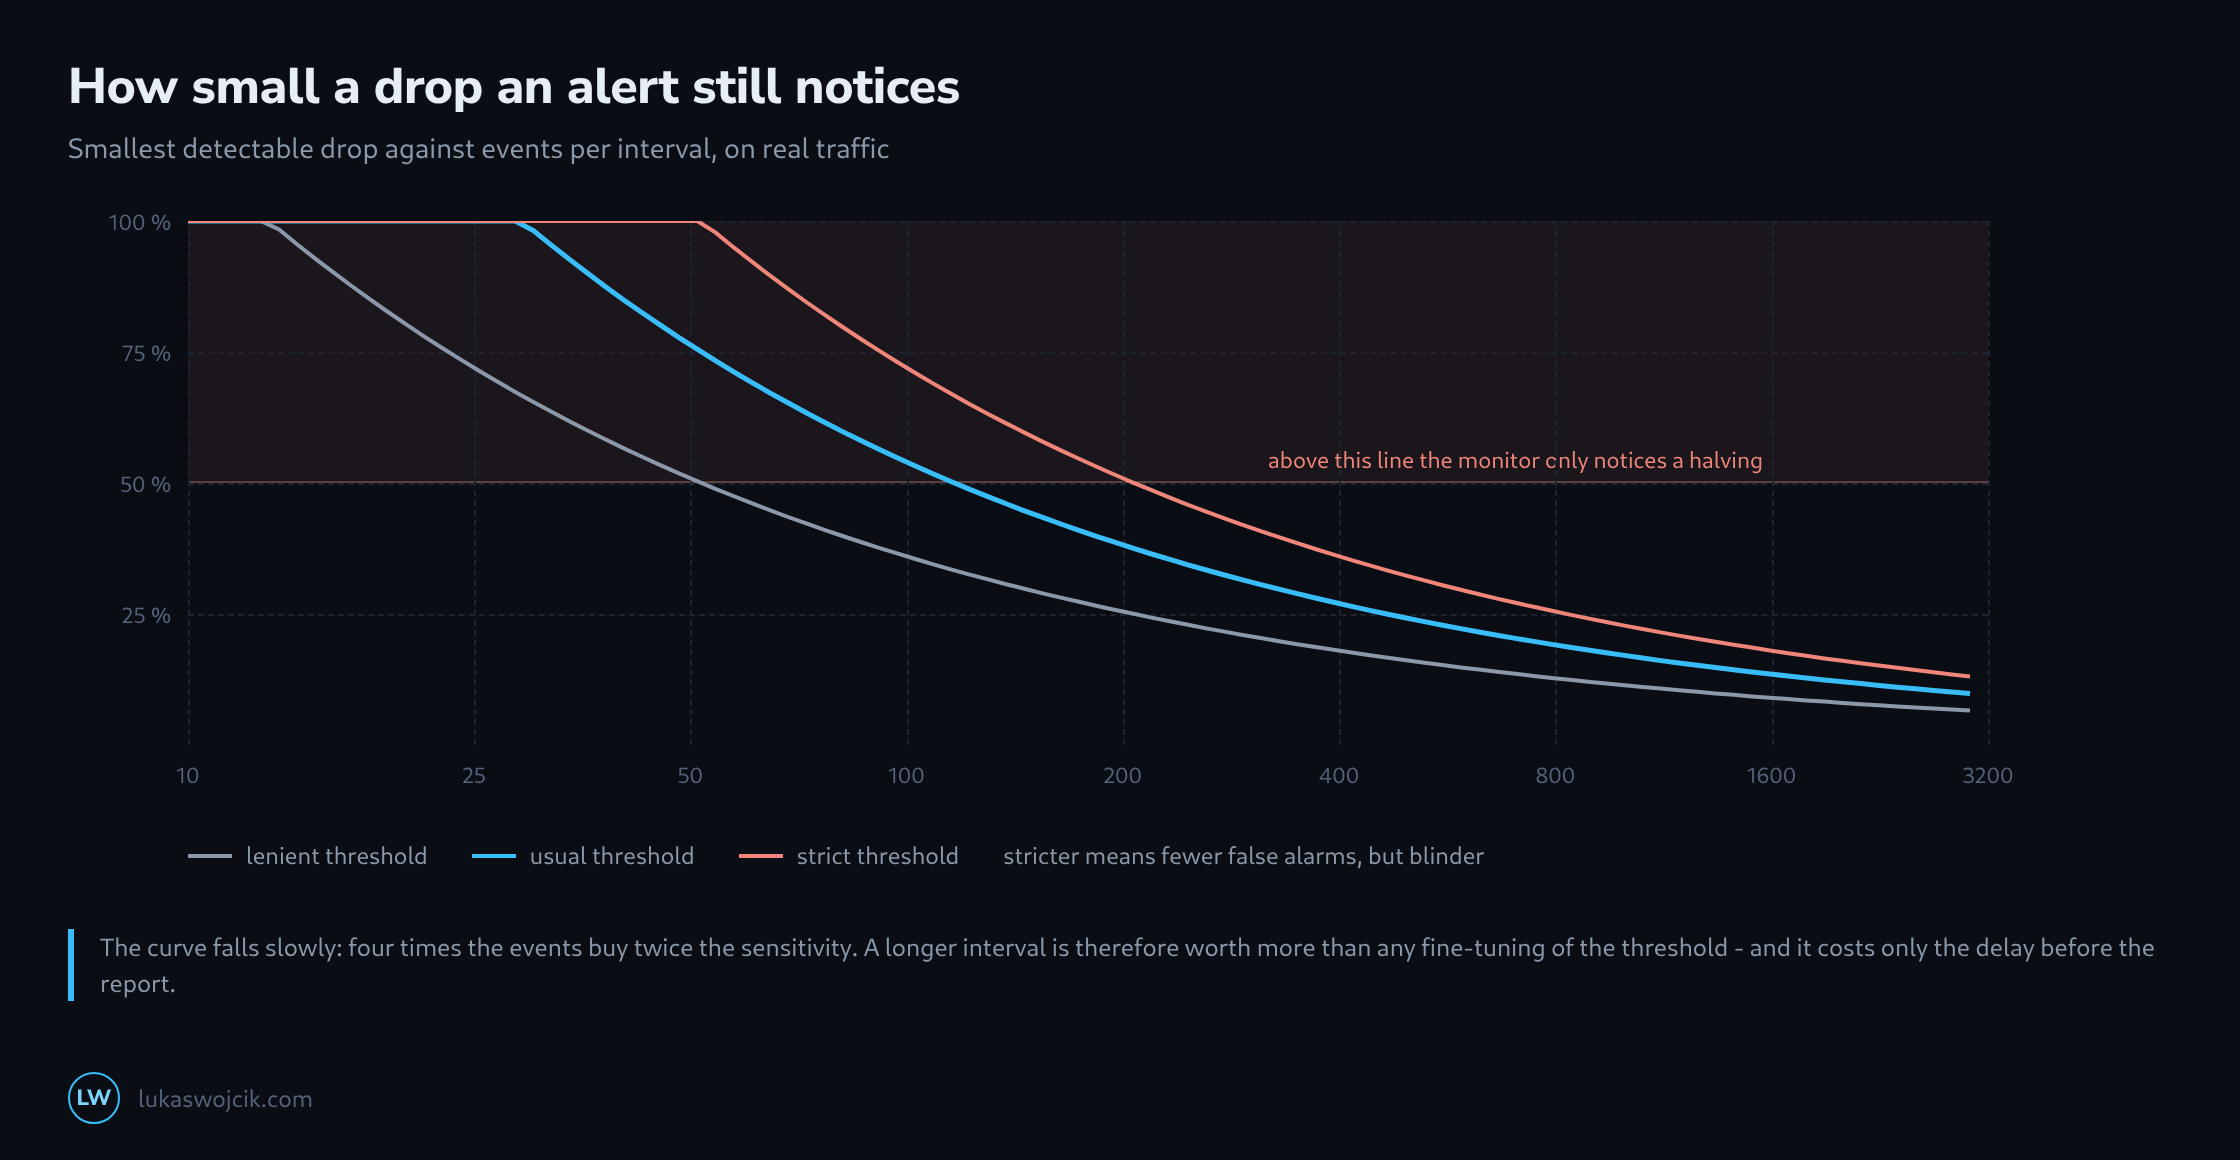
From that follows how large a drop has to be at minimum before it is significant and the alert can tell it apart from normal variation at all.
| Events per interval | Drop the alert notices at the earliest |
|---|---|
| 50 | 76 % |
| 200 | 38 % |
| 800 | 19 % |
| 3200 | 10 % |
The right-hand column is the whole article. It says what share of the traffic has to disappear before anything happens at all, and on fifty events per interval that share is three quarters. A broken cart button affecting a third of customers stays invisible there. The figures assume a usual threshold and real traffic, which swings more than plain counting does – more on that below.
Why a Lower Threshold Does Not Help
The obvious answer is to lower the threshold so that smaller drops already trip the alert. That does work: the detectable drop falls by about a third. But the number of false alarms rises seventeen-fold at the same time.
With hourly monitoring that means roughly one alarm every other day without anything having happened at all. An alert that cries wolf every other day is muted within a fortnight. After that the shop has no monitoring and a false sense of having some, which is a worse position than the one it started in.
The threshold is a trade between two failures: missing something, or raising an alarm for nothing. As long as the counts are small, that trade is bad at both ends.
A Longer Interval Instead of a Lower Threshold
There is a way that avoids the trade altogether: get more events into one interval by making the interval longer. Four times the events make the alert twice as sensitive, at the same threshold and the same false alarm rate per interval.
| Interval | Events in it | Smallest visible drop | Alarm arrives after |
|---|---|---|---|
| 5 min | 17 | 100 % | five minutes |
| 15 min | 50 | 76 % | a quarter of an hour |
| 1 h | 200 | 38 % | an hour |
| 4 h | 800 | 19 % | four hours |
Those figures belong to a shop with 4800 events a day, monitored around the clock. The five-minute row is the one usually configured, because five minutes sounds like a fast response – and it is the row that detects nothing at all.
What the longer interval costs is stated in the last column and nowhere else: an outage runs undetected for that long. Four hours is too long for a checkout and entirely reasonable for a nightly data feed. The interval therefore belongs to the thing being watched, not to a general house rule.
Real Traffic Swings More Than Counting Does
Up to here only the variation of counting has been in play. Real traffic also has a daily rhythm, a weekly rhythm and spikes around paydays. Held against a single flat average, all of that counts as variation too: the alert then takes closing time for an outage and the lunchtime peak for a recovery.
That is why the figures in the tables above are worse than plain counting would suggest. It is not a fudge but the price of a baseline that does not know what time it is.
A baseline built from the same hour of the same weekday over the past few weeks takes the rhythm out. That single change does more for sensitivity than any fine-tuning of the threshold – it works out roughly as if the shop had four times the traffic.
When the Numbers Are Simply Too Small
Some shops never reach three-digit counts in any interval short enough to be useful, and no amount of statistics changes that. What works there is to stop counting events and instead put two numbers into a ratio.
Sessions and cart events both fall at night and both rise on a Monday. Their ratio does neither; it stays calm while both individual numbers wander. A threshold on that ratio therefore still works at volumes where a threshold on the plain count is hopeless. A broken cart button moves the ratio immediately while barely touching the number of sessions.
The arithmetic of this article still applies throughout. It just applies to a quantity that is not already buried under the daily rhythm before the alert ever looks at it.
Related articles