Prometheus on a Raspberry Pi: How Labels Multiply Time Series and How to Find the Offender

Contents
A Raspberry Pi running Prometheus is usually sized by the number of exporters, which is the wrong unit. Prometheus does not store metrics; it stores one time series per distinct combination of label values, and the number of those combinations is a product.
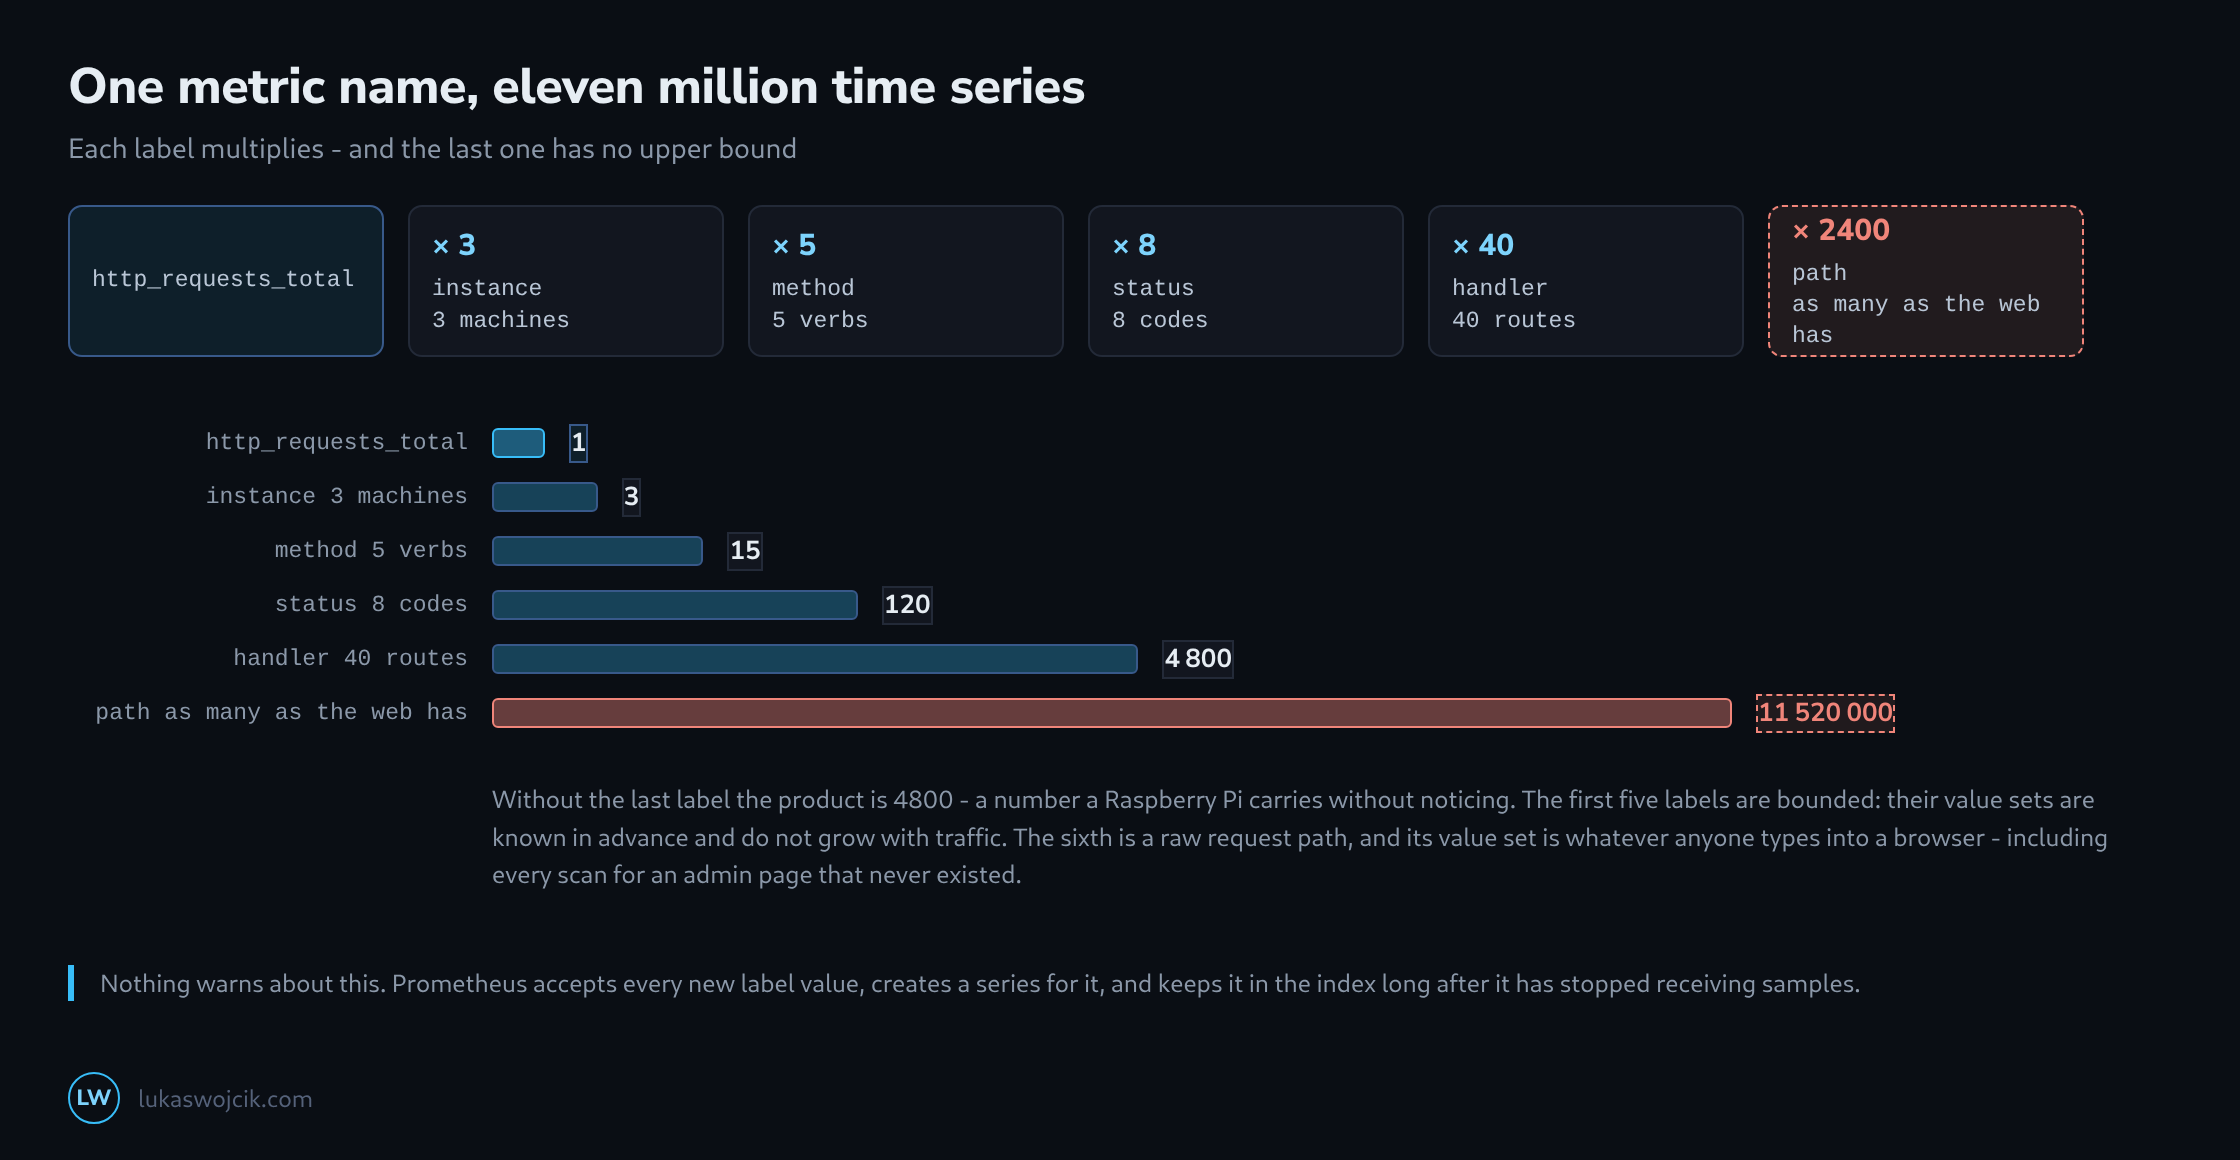
A product behaves differently from a sum. Adding a sixth exporter adds a few hundred series. Adding a sixth label to an existing metric multiplies everything that was already there.
Bounded and Unbounded Labels
The useful distinction is not how many values a label has today but whether its set of values is known in advance. method has five values and will still have five next year. status has a dozen. instance grows when a machine is added, which is a decision somebody makes.
A raw request path has as many values as there are strings, and it grows fastest when the site is under attack. Every scan for /wp-admin, /.env and /phpmyadmin creates a permanent time series in a monitoring system that was watching a site which does not have those pages.
| Label | Values | Bounded by |
|---|---|---|
job, instance |
a handful | the machines that exist |
method, status |
5 to 12 | the HTTP specification |
handler, route |
tens | the routes in the code |
path (raw) |
unbounded | nothing – it grows with scanners |
user_id, email |
unbounded | nothing, and it belongs in no monitoring system |
container_id, pod |
unbounded over time | nothing – a new value on every deploy |
The last row is the subtle one, because the number of series alive at any moment stays small. What grows without bound is the index, which has to remember every series that has ever existed within the retention window. A deploy every hour with a fresh container id produces a monitoring system that gets slower every week while the dashboard shows nothing unusual.
What It Costs in Practice
Memory is the binding constraint long before disk is. The head block holds every active series and its index in RAM, on the order of a few kilobytes per series, and a query touching many series needs room on top of that.
The failure is not gradual. Prometheus grows until the kernel kills it, restarts, replays the write-ahead log, grows again and gets killed again – usually within minutes of the first larger dashboard query. What looks like a broken exporter is a metric that gained a label three deploys ago.
The Three Queries That Find It
# which metric names carry the most series
topk(10, count by (__name__)({__name__=~".+"}))

# how many distinct values one label has, for one metric
count(count by (path) (http_requests_total))

# total series in the head block, and how fast it is growing
prometheus_tsdb_head_series
delta(prometheus_tsdb_head_series[1h])
The first query names the metric, the second names the label, and the third says whether the problem is a size or a leak. A head series count that rises steadily while nothing is being added is churn, and churn is always a label that changes when it should not.
These are worth running once on a healthy system, purely to know what normal looks like. A number without a baseline is not a diagnosis.
Dropping a Label Is One Line
The cheapest fix happens at scrape time, before anything is stored. A metric_relabel_configs block drops the label from the incoming samples, and everything downstream shrinks by the factor that label contributed.
scrape_configs:
  - job_name: 'app'
    static_configs:
      - targets: ['app:9100']
    metric_relabel_configs:
      - regex: 'path|user_id|container_id'
        action: labeldrop
Dropping is not the same as aggregating: the series for the individual paths disappear, and the counts they held are merged into whatever series remain. That is usually what was wanted anyway – almost nobody looks at a per-path request count, and the ones who do want it grouped by route rather than by URL.
Where the detail genuinely matters, the answer is to bound it at the source: label by handler or by a normalised route template rather than by the raw path, so that /product/12345 and /product/12346 become one series instead of two.
A Rule for New Metrics
Before a label is added, the question worth asking is what its value set is and who decides it. If the answer names a person or a configuration file, the label is bounded. If the answer is a visitor, a request, or an identifier, it is not – and it will be discovered later, from a Pi that no longer boots into a working Prometheus.
The same question also settles the privacy side of the matter, because the labels that are unbounded are exactly the ones that identify people. An email address in a metric label is a cardinality problem and a data protection problem in the same breath, and both are solved by not putting it there.
Sources
Related articles