English
 Deutsch
 Polski
Clipper or Limiter Before Export: Aliasing, True Peak and Encoding at −12 to −8 LUFS, Measured

Contents
To make a master louder, limiters and clippers restrain its peaks in different ways. A limiter lowers the gain just before a peak and releases it afterwards. A clipper cuts the peak off (hard curve) or rounds it (soft curve). In FL Studio, the manual describes Fruity Soft Clipper as a CPU-friendly soft limiter that avoids clipping with gentle, soft-knee compression.
The measurement compares six methods with the same ceiling of −1 dBFS: on a sine tone that makes aliasing readable, and on the synthetic test mix from the article True Peak After Encoding, mastered to −12, −10 and −8 LUFS and then encoded with AAC, MP3 and Opus.
How the measurement was made
- Methods: all in ffmpeg 7.1.5 with a ceiling of −1.0 dBFS on the samples. The limiter is alimiter with 5 ms attack and 50 ms release, the clippers are the hard and tanh curves of the asoftclip filter. Each method ran once directly at 44.1 kHz and once on the signal oversampled four times, converted up and back with soxr.
- A pitfall: the built-in oversampling of asoftclip was left out. In ffmpeg 7.1.5, with the hard curve it produced an undistorted sine at a lower level instead of clipping, and with the soft curve the harmonic became weaker with every step.
- Sine: 6.2 kHz, 6 dB above the ceiling. The spectrum of one second was analysed; everything except the fundamental and the harmonics at 12.4 and 18.6 kHz counts as non-harmonic content.
- Test mix: 32 seconds, −18.5 LUFS before mastering. The gain before each method was searched so that −12, −10 and −8 LUFS resulted. True peak per ITU-R BS.1770-5, plus a cross-check with 16-times oversampling.
- Waveform deviation: after aligning delay and level, the distance between the processed and the unprocessed signal was calculated. A high value means the waveform changes little; it says nothing about audibility.
- Encoding: AAC at 256 kbit/s (ffmpeg’s encoder), MP3 at 320 kbit/s (LAME) and Opus at 128 kbit/s, then decoded and measured again.
Sine: clipping creates aliasing, oversampling keeps it away
| Method | Harmonic at 18.6 kHz | Non-harmonic content | Strongest lines | Sample peak | True peak |
|---|---|---|---|---|---|
| Limiter | none | −83 dB | 6.1 and 6.3 kHz | −1.00 dBFS | −0.82 dBTP |
| Limiter, 4 times | none | −135 dB | – | −1.00 dBFS | −0.82 dBTP |
| Hard clipper | −12.9 dB | −25 dB | 13.1, 11.7 and 0.7 kHz | −1.00 dBFS | +0.50 dBTP |
| Hard clipper, 4 times | −12.9 dB | −51 dB | 9.0 and 3.4 kHz | −0.39 dBFS | −0.14 dBTP |
| Soft clipper | −15.5 dB | −28 dB | 13.1 and 0.7 kHz | −1.32 dBFS | −0.94 dBTP |
| Soft clipper, 4 times | −15.5 dB | −136 dB | – | −1.29 dBFS | −0.72 dBTP |
A clipper creates harmonics far above half the sample rate. At 44.1 kHz they fold back into the audible range: the tone at 6.2 kHz produced lines at 13.1, 11.7 and 0.7 kHz that bear no harmonic relation to the tone and together were only 25 dB below the fundamental. Without oversampling, the soft curve hardly reduced this. Julius O. Smith describes both effects: nonlinearities cause aliasing in the digital domain, and smoothing the corners of the nonlinearity reduces it. With four-times oversampling, aliasing fell to −136 dB for the soft clipper but only to −51 dB for the hard clipper, because its harmonics extend beyond four times the sample rate.
Two further findings concern the peaks. The hard clipper without oversampling held the samples at −1.00 dBFS, but the true peak was +0.50 dBTP. With oversampling, the samples themselves rose above the ceiling, to −0.39 dBFS: converting back to 44.1 kHz removes the harmonics above 22 kHz, and the previously clipped peak swings back over the ceiling. The limiter held −1.00 dBFS in both cases; the lines 100 Hz either side of the tone, as produced by fluctuating gain, were at −86 dB.
Test mix: same loudness, different peaks
| Method | True peak at −12 LUFS | at −10 LUFS | at −8 LUFS | 16 times at −8 LUFS | Waveform deviation at −8 LUFS |
|---|---|---|---|---|---|
| Limiter | −0.82 dBTP | −0.73 dBTP | −0.29 dBTP | −0.15 dBTP | 17.1 dB |
| Limiter, 4 times | −0.95 dBTP | −0.88 dBTP | −0.88 dBTP | −0.86 dBTP | 16.6 dB |
| Hard clipper | −0.75 dBTP | −0.35 dBTP | +0.10 dBTP | +0.41 dBTP | 31.1 dB |
| Hard clipper, 4 times | −0.48 dBTP | −0.34 dBTP | −0.12 dBTP | −0.14 dBTP | 28.7 dB |
| Soft clipper | −2.42 dBTP | −1.64 dBTP | −1.17 dBTP | −0.81 dBTP | 20.9 dB |
| Soft clipper, 4 times | −2.28 dBTP | −1.44 dBTP | −0.96 dBTP | −0.92 dBTP | 20.6 dB |
The hard clipper changed the waveform least: at −12 LUFS the deviation was 57 dB below the signal, compared with 37 dB for the limiter; at −8 LUFS it was 31 against 17 dB. The hard clipper only touches the samples above the ceiling, while the limiter lowers the gain around every peak. The tanh curve bends the signal even below the ceiling; its peaks therefore stayed 1.4 dB below the ceiling at −12 LUFS, but at −8 LUFS it had the smallest distance between peak and loudness, 6.8 and 7.0 dB.
True peak shows the price of the hard clipper: at −8 LUFS it reached +0.10 dBTP per BS.1770 and +0.41 dBTP in the 16-times cross-check, although no sample exceeded −1 dBFS. The oversampled limiter stayed at no more than −0.86 dBTP for every target, in the cross-check as well.
After encoding: clipped masters rise most
| Method at −8 LUFS | True peak before | After AAC 256 | After MP3 320 | After Opus 128 | Samples above 0 dBFS after AAC |
|---|---|---|---|---|---|
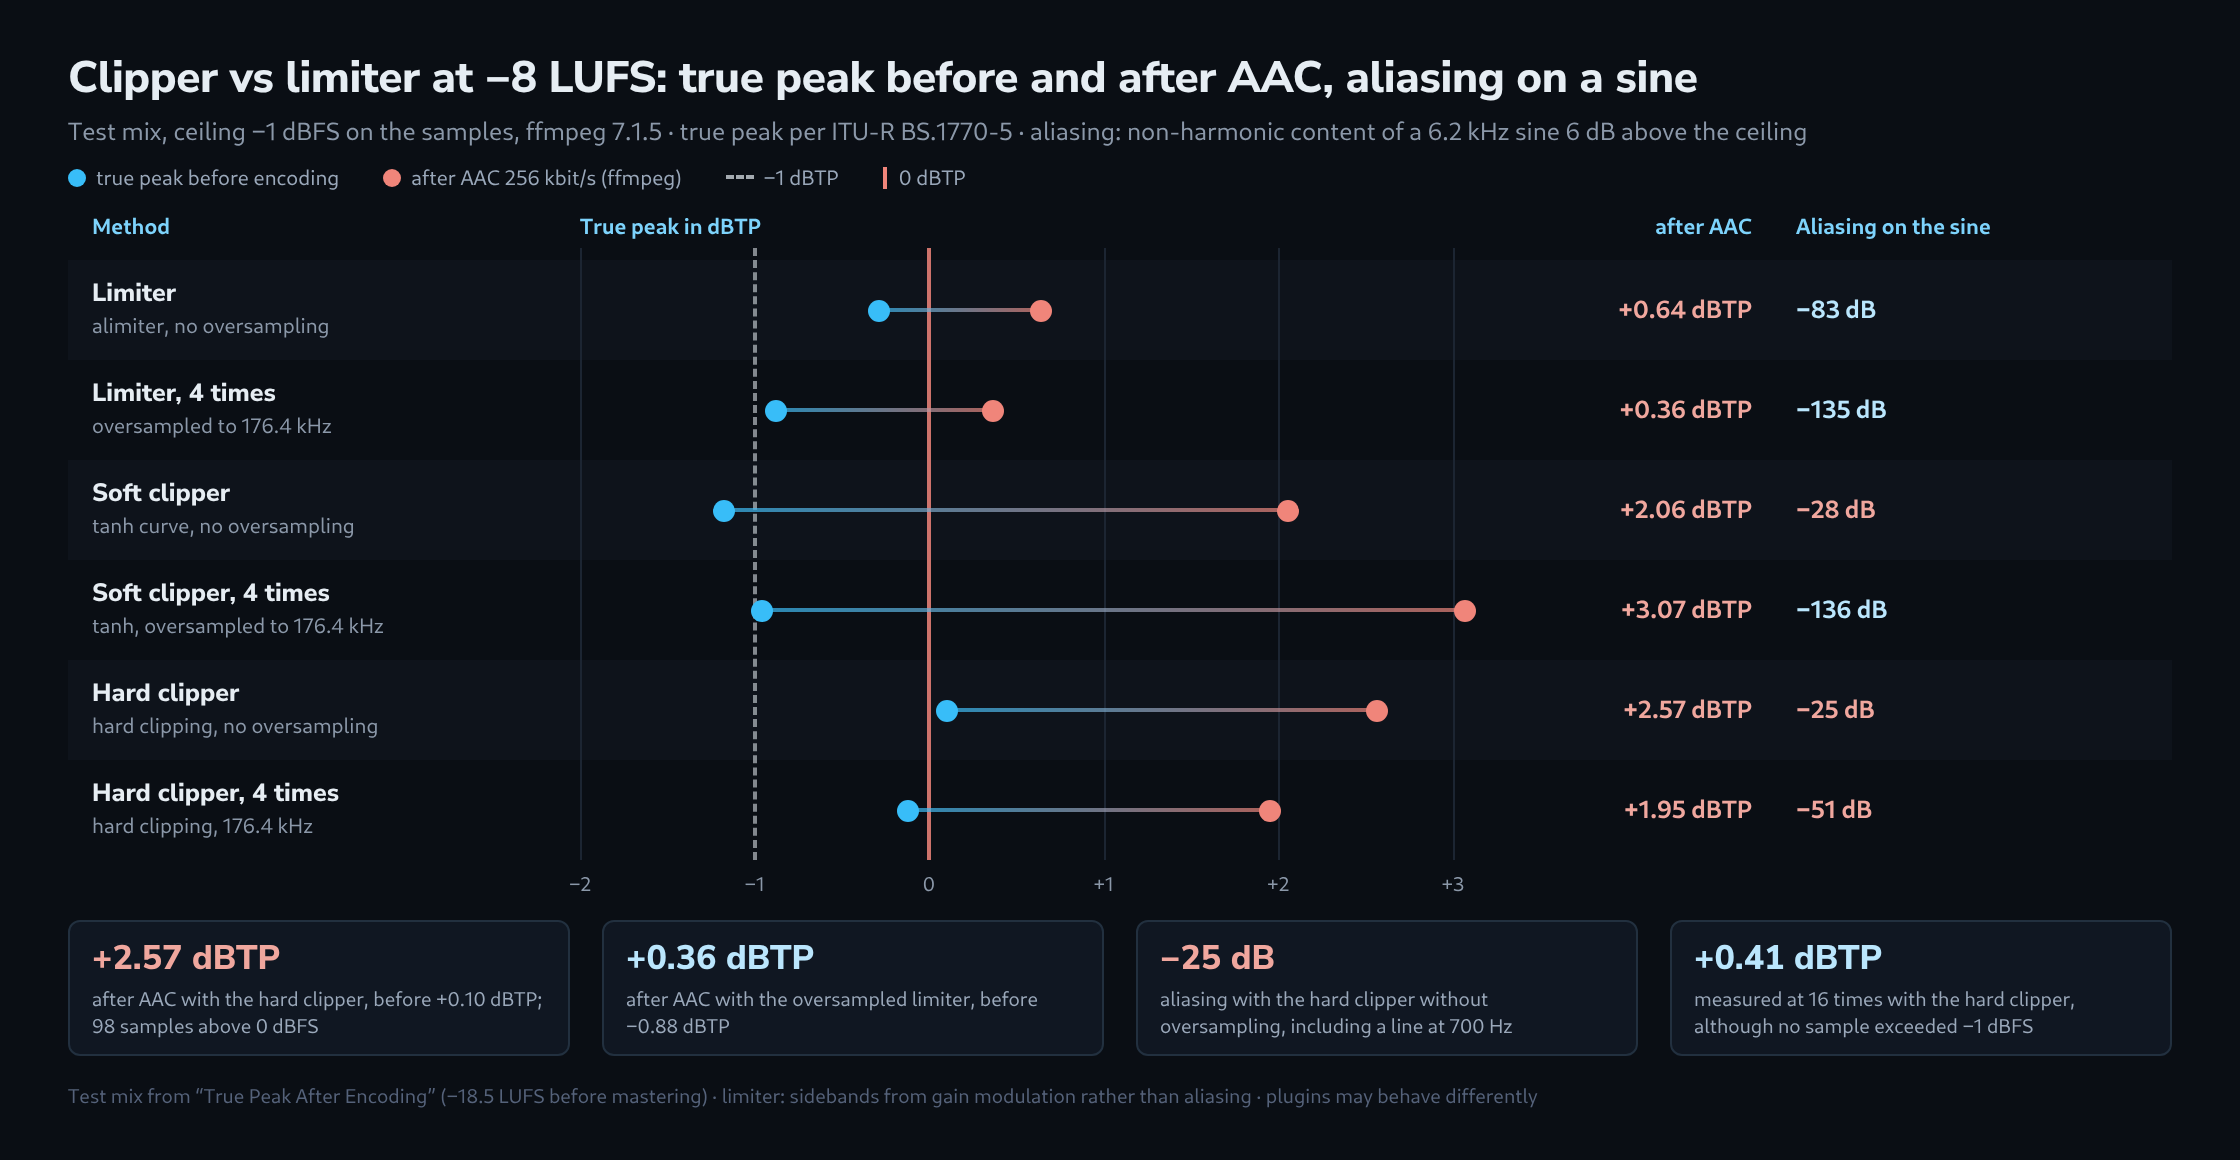
| Limiter | −0.29 dBTP | +0.64 dBTP | −0.21 dBTP | +0.21 dBTP | 2 |
| Limiter, 4 times | −0.88 dBTP | +0.36 dBTP | −0.52 dBTP | −0.01 dBTP | 3 |
| Hard clipper | +0.10 dBTP | +2.57 dBTP | +0.27 dBTP | +0.77 dBTP | 98 |
| Hard clipper, 4 times | −0.12 dBTP | +1.95 dBTP | +0.12 dBTP | +1.05 dBTP | 101 |
| Soft clipper | −1.17 dBTP | +2.06 dBTP | −0.79 dBTP | +0.19 dBTP | 8 |
| Soft clipper, 4 times | −0.96 dBTP | +3.07 dBTP | −0.95 dBTP | −0.08 dBTP | 12 |
With ffmpeg’s AAC encoder, the clipped masters at −8 LUFS rose by 2.1 to 4.0 dB, the limited ones by 0.9 and 1.2 dB. A cross-check with 16-times oversampling confirmed the values, and the decoded files contained real overs: 98 and 101 samples above 0 dBFS in 32 seconds of stereo for the hard clipper, 2 and 3 for the limiter. MP3 at 320 kbit/s raised the peaks by no more than 0.38 dB, Opus at 128 kbit/s by up to 1.37 dB. At −10 LUFS every method was above 0 dBTP after AAC, the hard clippers at +1.65 dBTP; at −12 LUFS all six stayed below it after all three codecs.
What this means for the master
- A clipper without oversampling creates aliasing around 25 dB below the fundamental on a single tone, even with a soft curve. Where a clipper is used, oversampling belongs switched on; the soft curve benefits from it far more than the hard one.
- Oversampled clippers no longer hold their ceiling exactly on the samples; in the test mix at −8 LUFS they exceeded it by up to 0.9 dB. A ceiling with some margin or a limiter afterwards catches this.
- At −8 LUFS the oversampled limiter had the lowest true peak before and after AAC. At −12 and −10 LUFS the soft clippers were lower before encoding because their curve rounds the peaks more strongly, but they had the smallest distance between peak and loudness. The result matches the mastering tutorial for FL Studio, in which an oversampled limiter managed with a ceiling of −1.15 dBFS.
- The louder the master, the more the peaks rise during encoding: at −8 LUFS, clipped masters were more than 2 dB higher after AAC than before. The LUFS and True Peak Meter measures the true peak of an export in the browser, including encoded files.
Context and limits
The measurement used a synthetic test mix and ffmpeg’s filters as stand-ins. Plugins such as Fruity Soft Clipper, Fruity Limiter or Maximus work with their own curves, time constants and oversampling methods and may give different values. The basic patterns, aliasing without oversampling and overshoot with oversampling, are general properties of digital nonlinearities, however. ffmpeg’s AAC encoder is not the encoder used by streaming services. A listening test was not part of the measurement: how audible aliasing at −25 dB or a waveform deviation of 17 dB is in a mix depends on the material.
Questions and answers
How does a 6.2 kHz tone produce lines at precisely 13.1, 11.7 and 0.7 kHz?
By folding at half the sample rate. Both curves are symmetrical around zero and therefore create odd harmonics: 18.6 kHz, 31.0 kHz, 43.4 kHz, 55.8 kHz and so on. Only the first of these lies below 22.05 kHz. Every higher one cannot be represented at 44.1 kHz and appears at its distance from the nearest multiple of the sample rate: 44.1 − 31.0 = 13.1 kHz, 44.1 − 43.4 = 0.7 kHz and 55.8 − 44.1 = 11.7 kHz. Those are exactly the three strongest lines of the hard clipper.
The same arithmetic explains why four-times oversampling helps the hard clipper less. At 176.4 kHz only very high harmonics fold back, such as the 27th at 167.4 kHz onto 9.0 kHz and the 29th at 179.8 kHz onto 3.4 kHz, the two strongest lines in the table. With the hard clipper the harmonics decrease only slowly with rising order and are still clearly present there; the tanh curve has no corner, its harmonics fall off much faster, and by the 27th hardly anything is left. Hence −51 against −136 dB.
How low would the ceiling have to be for a −8 LUFS master to stay below 0 dBTP after AAC?
The measurements give an order of magnitude. With the oversampled limiter, AAC raised the true peak by 1.24 dB, from −0.88 to +0.36 dBTP. If the rise stayed the same, the master could reach no more than −1.24 dBTP before encoding, about 0.4 dB lower. With the clippers the rise was between 2.07 and 4.03 dB; there the peaks would have to sit about 2 to 3 dB lower, which at the same loudness means correspondingly heavier limiting.
Whether the rise really stays the same with a lower ceiling was not measured, and ffmpeg’s AAC encoder is not the one used by streaming services. The direction does match Spotify, which in its guidance on loudness normalisation recommends a maximum of −2 dBTP for masters louder than −14 LUFS, because loud tracks distort more in transcoding.
Does a clipper in front of the limiter help, with both in series?
Following the logic of the measurement, yes, provided both run oversampled. The soft clipper rounds the peaks with little aliasing and reduces the distance between peak and loudness, and the limiter behind it catches the overshoots of up to 0.9 dB that the clipper produces when converting back. How the chain fares after encoding was not measured.
Sources
- Practical Advice – Physical Audio Signal Processing (Julius O. Smith III)
- Nonlinearities – Physical Modeling Synthesis Update (Julius O. Smith III)
- Fruity Soft Clipper – Effect Plugin
- FFmpeg Filters Documentation
- ITU-R BS.1770: Algorithms to measure audio programme loudness and true-peak audio level
- EBU Tech 3343: Guidelines for Production of Programmes in accordance with R 128
Related articles