English
 Deutsch
 Polski
Meridian in Analytics 360 and GeoX: Mix Modelling With Intervals and Geo Experiments

Contents
At Marketing Live on 20 May 2026 Google announced several measurement tools at once. The most interesting news among them is not a new feature but a change of address: Meridian, the company’s open-source mix model, has moved into Analytics 360. Two weeks earlier GeoX had been previewed, an equally open-source tool for experiments across regions.
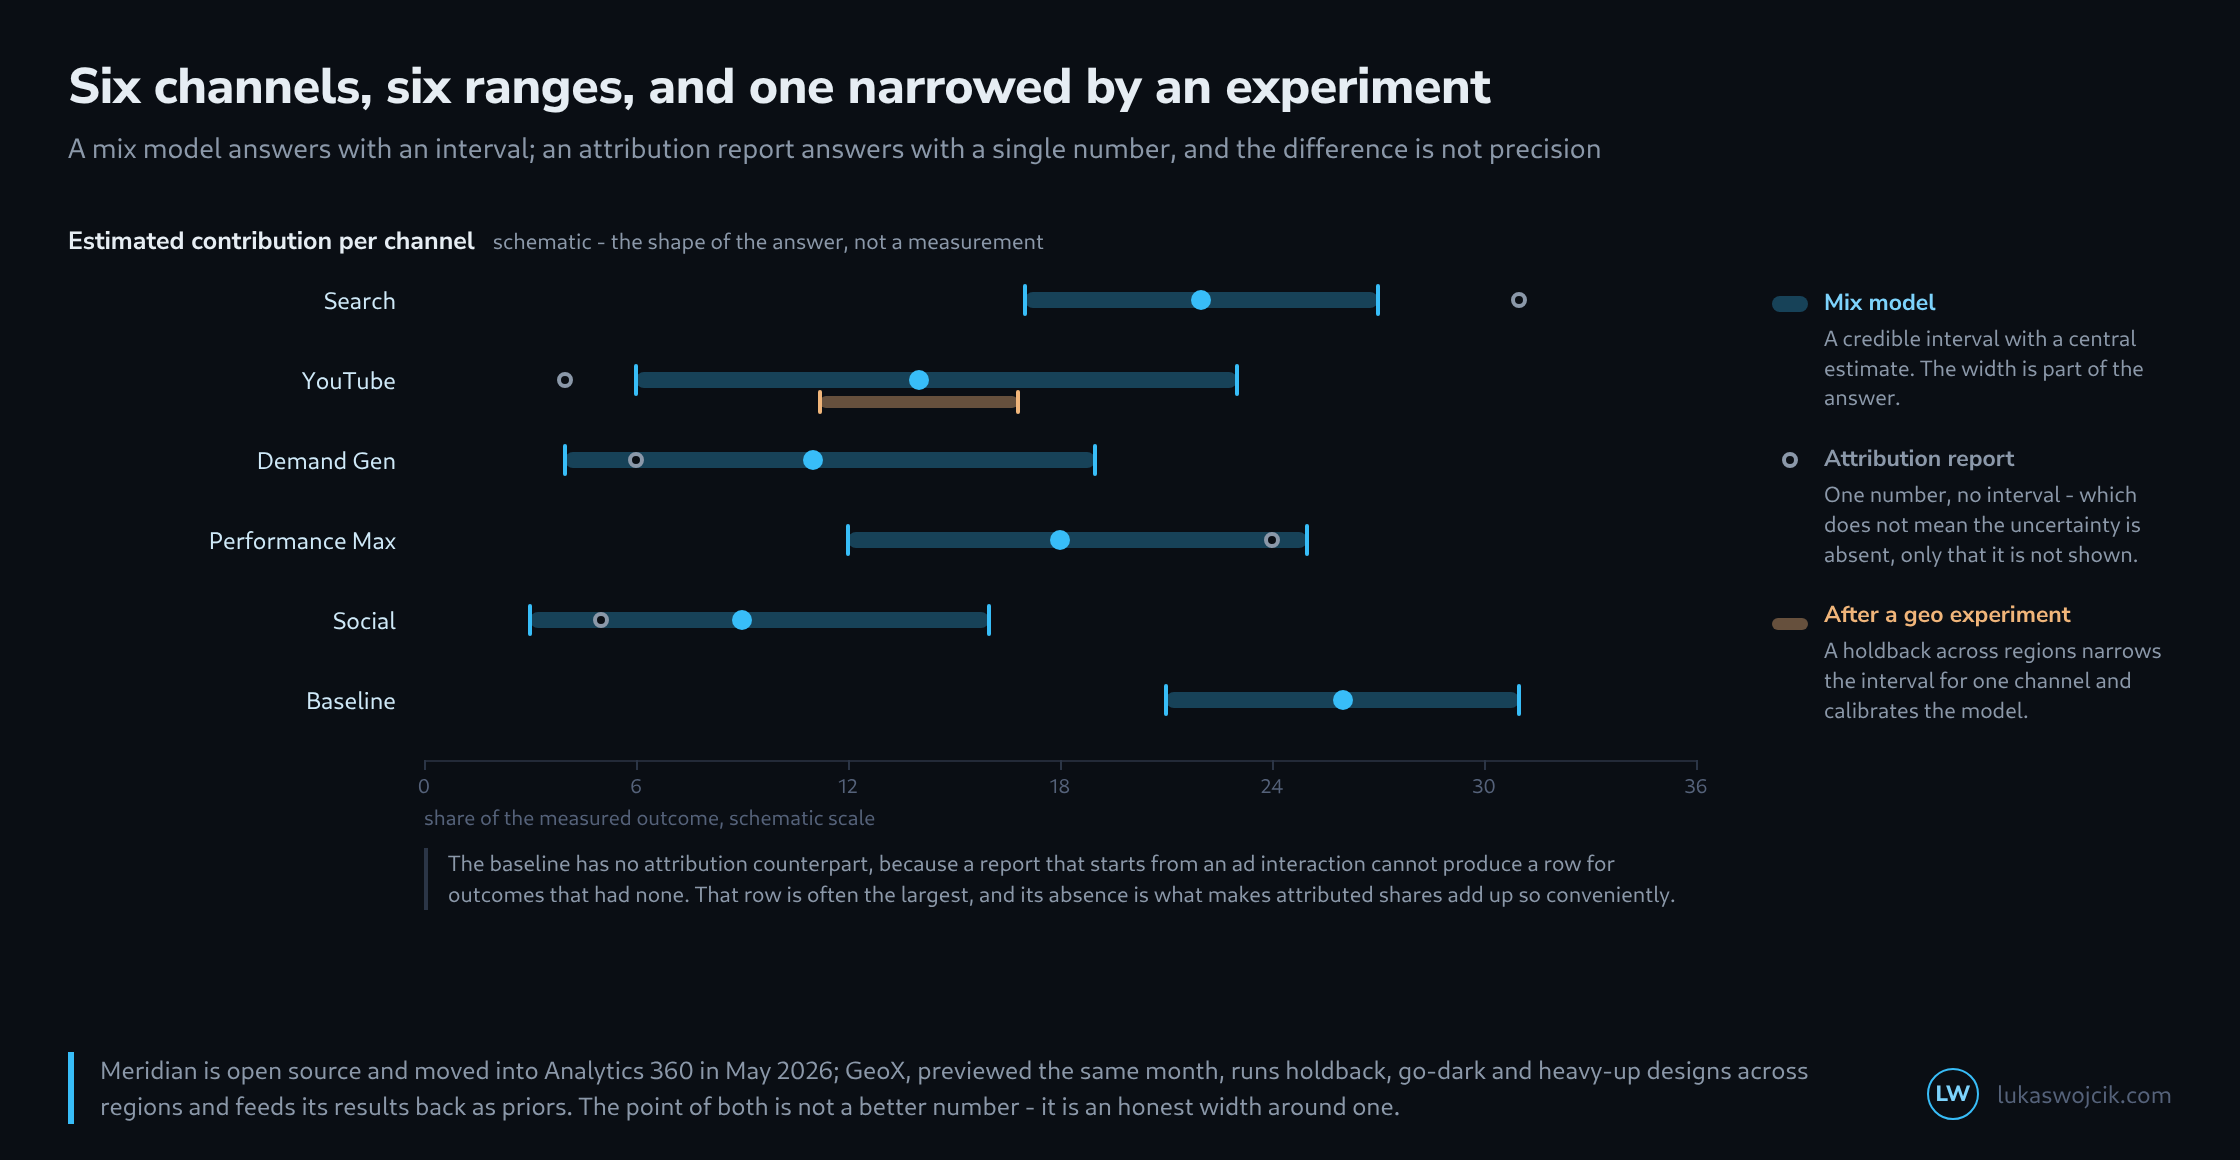
Both answer the same question – what did the spend cause – and both answer it differently from an attribution report. They deliver a range instead of a number, and that is not a lack of precision but the finding itself.
What moved into Analytics 360
Meridian brings first-party data from GA4 together with spend and impressions from outside channels, TikTok, Pinterest and Snap among those named. Added to this is a natural-language interface for planning questions of the form: what happens to the outcome if part of the budget moves from one channel to another.
The limitation sits right beside it: the integration exists in the paid tier, not the free one. Meridian itself remains open source and can be run independently – what moved into Analytics 360 is the convenience, not the model.
Why a range says more than a number
A mix model estimates from time series how much each channel contributed to the outcome, and states a range within which the true value very probably lies. That width arises from the data: spending the same amount on a channel for two years gives the model no variation from which an effect could be read – the range stays wide, and that is the correct finding.
An attribution report, by contrast, emits a single number. It looks more precise but is not; it merely does not show its uncertainty. There is also a difference easily overlooked: a report that begins at an ad interaction cannot form a row at all for conversions that had none. That very row – the baseline – is the largest one in many organisations, and its absence is why attributed shares add up to a hundred per cent so conveniently.
What GeoX contributes
A model estimates; an experiment demonstrates. GeoX turns regions into a comparison group: in one part of a country the advertising continues, in another it is held back, switched off or increased, and the difference in outcome is the effect. That is a causal statement rather than a modelling assumption.
Three designs, the same logic

  holdback   channel runs everywhere except in the test regions
  go dark    channel is stopped entirely in the test regions
  heavy up   channel receives more budget in the test regions

  What is measured is always the difference between test and
  control regions, never the trend in the test regions alone.
  Several cells in one study share a single control group, which
  lowers runtime and cost against running separate studies.

  The result feeds back into the mix model as a prior and narrows
  the interval of the channel that was examined.
That return path is the real gain. An experiment alone measures one channel in one period; a model alone estimates every channel with wide ranges. Feeding the experiment in as a prior produces a model whose ranges are narrow exactly where something was actually measured.
What else was announced
Three further changes belong to the same announcement. Qualified Future Conversions uses Gemini to estimate conversions still to come within 180 days of an ad interaction – justified by the observation that for Demand Gen only part of the conversions fall within the first thirty days. It appears in three columns of its own and currently runs as a restricted pilot.
Campaign Type Attribution separates the contribution of Demand Gen from that of the other campaign types, which Google’s own de-duplication previously prevented. Attributed Brand Searches counts branded searches traceable to YouTube advertising on an ongoing basis rather than in individual studies.
The first two are estimates arriving in the shape of columns. An estimated figure in a column beside counted figures is an invitation to confuse the two, and the column heading is the only indication that two different kinds of thing are standing side by side.
What follows in practice
A mix model is not worth it for everyone. It needs several years of data, variation in spend, and somebody who reads the ranges instead of copying out the central estimate. Taking the central estimate and dropping the range builds an expensive route to the same false precision the exercise was meant to leave behind.
A regional experiment, by contrast, is possible at modest scale, and it answers the question no attribution answers: whether the same conversions would have arrived without the spend. That question is uncomfortable, because for some channels the honest answer is that a substantial share would have arrived anyway – and that is exactly why it is worth asking.
Questions and answers
Why does an experiment help the mix model more than further months of unchanged spend?
Because the model needs variation and constant spend provides none. An experiment creates variation with a known cause: spend changes in the test regions because it was changed on purpose, not because it is peak season or demand is rising. That is precisely the separation the model cannot draw from its own time series.
What limits a regional experiment at modest scale?
Mainly four things, all of which either blur the line between test and control regions or widen the range of the result:
- Spillover between regions. People commute, travel and see advertising meant for another region, and regional ad targeting often rests on approximate location data. Every such case makes test and control groups more alike, and the measured effect comes out too small.
- Assigning conversions. An online conversion needs a region, for instance via the delivery address. Where that fails, it is missing from both groups or ends up in the wrong one.
- The number of regions. A few large regions mean few points of comparison, and each region’s own fluctuation, from weather or school holidays for example, then weighs heavily in the result. The range becomes wide, which is correct but makes the decision harder.
- The duration. The experiment has to run long enough to capture later conversions as well; the observation from the same announcement that for Demand Gen only part of the conversions fall within the first thirty days suggests that an experiment, too, has to wait out that lag before it is evaluated.
There is also a price: holding back or going dark costs the test regions the conversions the channel would actually have brought there. The size of that price is exactly what the experiment measures.
Sources
Related articles