English
 Deutsch
 Polski
Four Kinds of Number in a Conversion Report: Counted, Modelled, Projected and Estimated With a Range

Contents
A conversion report now holds four different kinds of number. Three of them look alike – same typeface, same column width, same alignment. The fourth looks different, and that is its advantage.
The distinction is not academic. It decides whether a figure may be added, compared, re-counted and named in a contract.
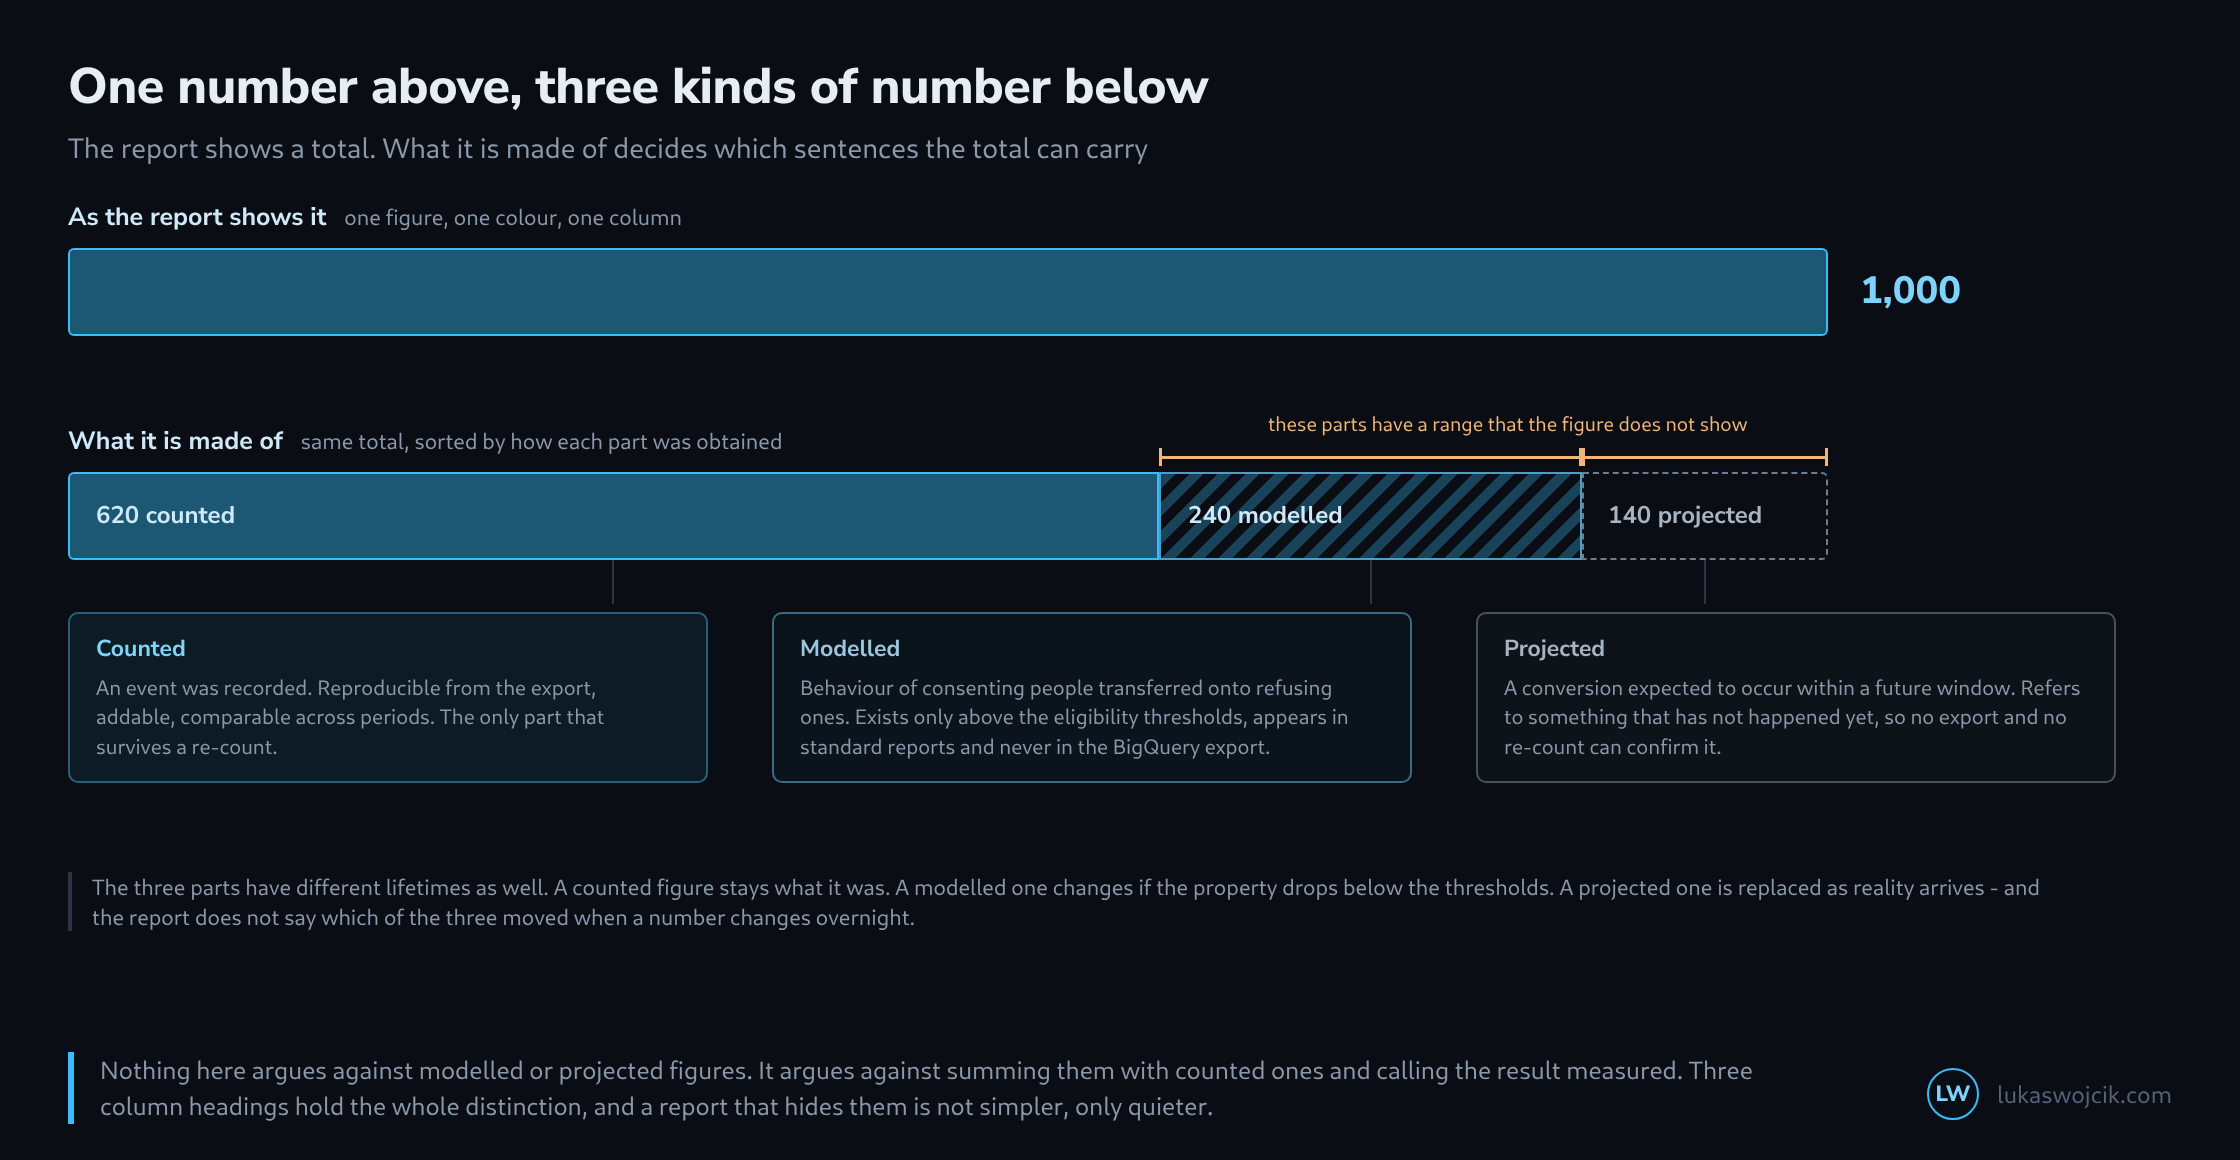
Counted
An event arrived and was recorded. This figure has three properties none of the others has: it can be reproduced from the raw data, it can be added across periods, and it does not change any more. Re-counting it in two years gives the same result.
That is the part a sentence like “there were 620 in September” actually fits. Everything else needs a qualifier.
Modelled
Under consent mode a model transfers the behaviour of consenting people onto refusing ones. What comes out appears in standard reports beside the counted values and is indistinguishable from them there.
Two properties make this figure awkward. It exists only while a property meets the eligibility thresholds – and eligibility can be lost and regained with no note beside it. And it never appears in the BigQuery export. Comparing the reported figure against a query on the raw data produces a discrepancy that has no cause in the data, only in the definition.
Projected
The newest kind is the least familiar. Qualified Future Conversions estimate conversions still to occur within 180 days of an ad interaction, and appear in columns of their own beside the existing ones. They currently run as a restricted pilot.
The difference from everything else is fundamental: this figure does not refer to the past. It is not an estimate of an unobserved part of the past but a statement about the future. No re-count can therefore confirm or refute it – not this quarter, at any rate.
Four kinds, four tests

  kind         reproducible    addable    changes        range
                from export     over time  later          stated

  counted       yes             yes        no             n/a
  modelled      no              with care  yes, unnoticed no
  projected     no              no         yes, by design no
  estimated     yes, via model  no         on a re-run    yes

  Only the last kind states its uncertainty unprompted.
  Only the first survives a re-count unchanged.
Estimated, and with a range
A mix model reports a central estimate and a range within which the true value very probably lies. Of the four kinds this is the only one that supplies its uncertainty rather than withholding it.
That is exactly why it looks different in a report, and exactly why it is misused most often: copying out the central estimate and dropping the range turns the most honest of the four figures into the most misleading.
How to tell which kind a figure is
Three tests suffice and cost minutes each. The first is the column heading: if it says modelled, estimated, predicted, or carries a marker, the question is answered. The second is the export – a figure that cannot be rebuilt from the raw data is not a counted one. The third is the temporal reference: a figure referring to a window in the future is a projection, whatever it is called.
Which figure carries which sentence
For counted values the plain sentence holds: there were this many. For modelled ones: there were approximately this many, under the model’s assumptions, and the export says something else. For projected ones: this many are expected by then. For estimated ones with a range: the contribution probably lies between X and Y.
None of those sentences is worse than the others. What is bad is using the first when one of the others applies – and that happens not out of dishonesty but because four kinds of number sit in the same row and the column heading is the only difference.
Questions and answers
Does a counted figure really stay unchanged, even a few days after the period ends?
Only after a settling period. Three processes still change counted values afterwards without turning them into a different kind of number:
- Processing time. Events from the last few days are often not yet fully processed in reports; pulling the previous month on the first of the month may return figures that are too low for its final days.
- Attribution to the click date. Google Ads records conversions by default on the date of the ad interaction. A purchase a week after the click raises the figure for the click date retroactively, so the most recent days keep growing while the conversion window is open.
- Corrections and deletions. Cancelled purchases reported later as adjustments, or deleted user data, reduce a figure that has already been reported.
The property “does not change any more” therefore holds for a period whose windows have closed. For reports that serve as the basis of a contract, a fixed extraction date, recorded together with the figure, is worth the effort.
Can two months be compared when only one of them contains modelled values?
Not directly. The difference then reflects not only the actual change but also the modelling being switched on or off, and the report carries no note of it. The counted values from the export make the more meaningful comparison, because the same definition applies to both months there.
How can a projection be checked later?
Only once its window has passed, and only with some preparation. For Qualified Future Conversions that is 180 days after the ad interaction. After that, the projection can be set against the counted conversions, as far as these can be traced to the same interactions.
The preparation consists of recording the projected value at reporting time, together with the date it was retrieved. The article’s table lists projections as figures that change by design; anyone looking only after half a year may find a different value in the column from the one reported back then, and can no longer check the original statement.
Why can the ranges of several periods or channels not simply be added up?
Because the range of a sum depends on how the individual estimates relate to one another. Adding up the lower bounds and the upper bounds only gives the correct range if all individual estimates move in complete lockstep. If they are independent, deviations partly cancel out, and the added range comes out wider than the actual one.
In a mix model, negatively correlated estimates are even typical. If two channels always run at the same time, the model struggles to split their joint contribution and credits it sometimes to one, sometimes to the other. Both individual ranges become wide, while the range of their sum stays narrow. The range of a sum therefore has to come from the model itself, for instance from its samples of the joint distribution, not from arithmetic on the published individual figures. This fits the article’s table, which lists estimated figures as not addable over time.
Sources
Related articles